For more information visit our Microsoft app source link https://appsource.microsoft.com/en-us/product/power-bi-visuals/officesolution1640276900203.calendar-chart-for-power-bi?tab=Overview
Office Solution Capacity Monitoring tool enables organizations to track Centrally:-
The chart you are working with is designed to provide users with power
The Spiral Plot by Office Solution offers a unique way to visualize da
Empower users with dynamic bar charts, allowing real-time numeric aggr
Experience the versatility of Line and Scatter Plot Chart, where you c
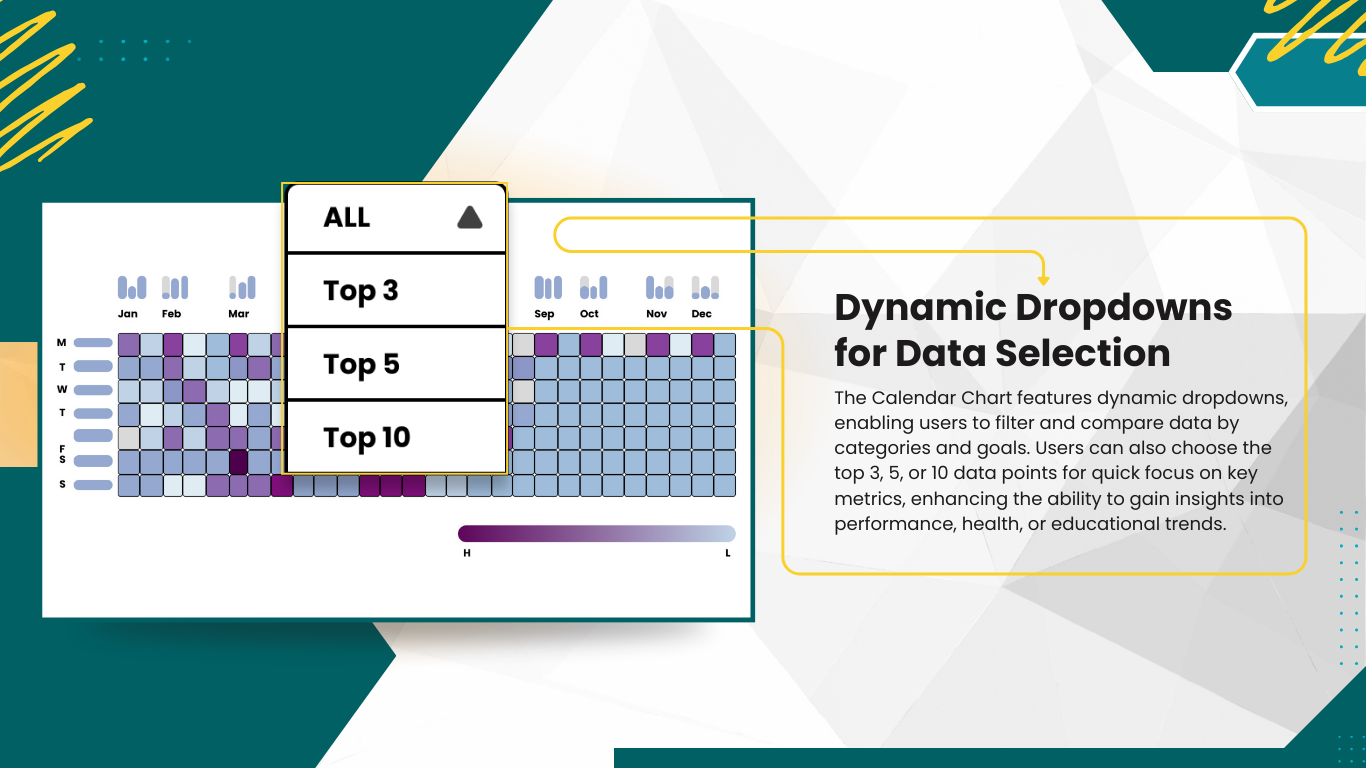
Select Top N number of items to be displayed in chart and rest items w
The Circular Dendrogram Chart offers a unique and vis