Product Detail

Client Coverage Network Timeline

Tool Is Certified by Microsoft:

Problem Statement

In corporate and investment banking, coverage executives and deal leads struggle to maintain a unified picture of client activity, deal progression, and wallet monetization across departments. Common challenges include:

  1. Fragmented Relationship Visibility: Client interactions, pitches, mandates, and deal closings are scattered across separate systems, obscuring multi-year coverage continuity.

  2. Hidden Wallet Potential: Reporting tools show realized revenues but rarely contrast them against total addressable wallet targets on an event-by-event basis.

  3. Invisible Syndicate Networks: Complex co-coverage handoffs, syndication partner flows, and cross-lane counterparty ties cannot be represented on conventional linear charts.

  4. Inflexible Granularity: Switching between officers, client tiers, date hierarchies, and revenue measures normally requires configuring multiple visual tiles.

The Client Coverage & Wallet Share Network Timeline resolves these limitations with dedicated institutional analytics:

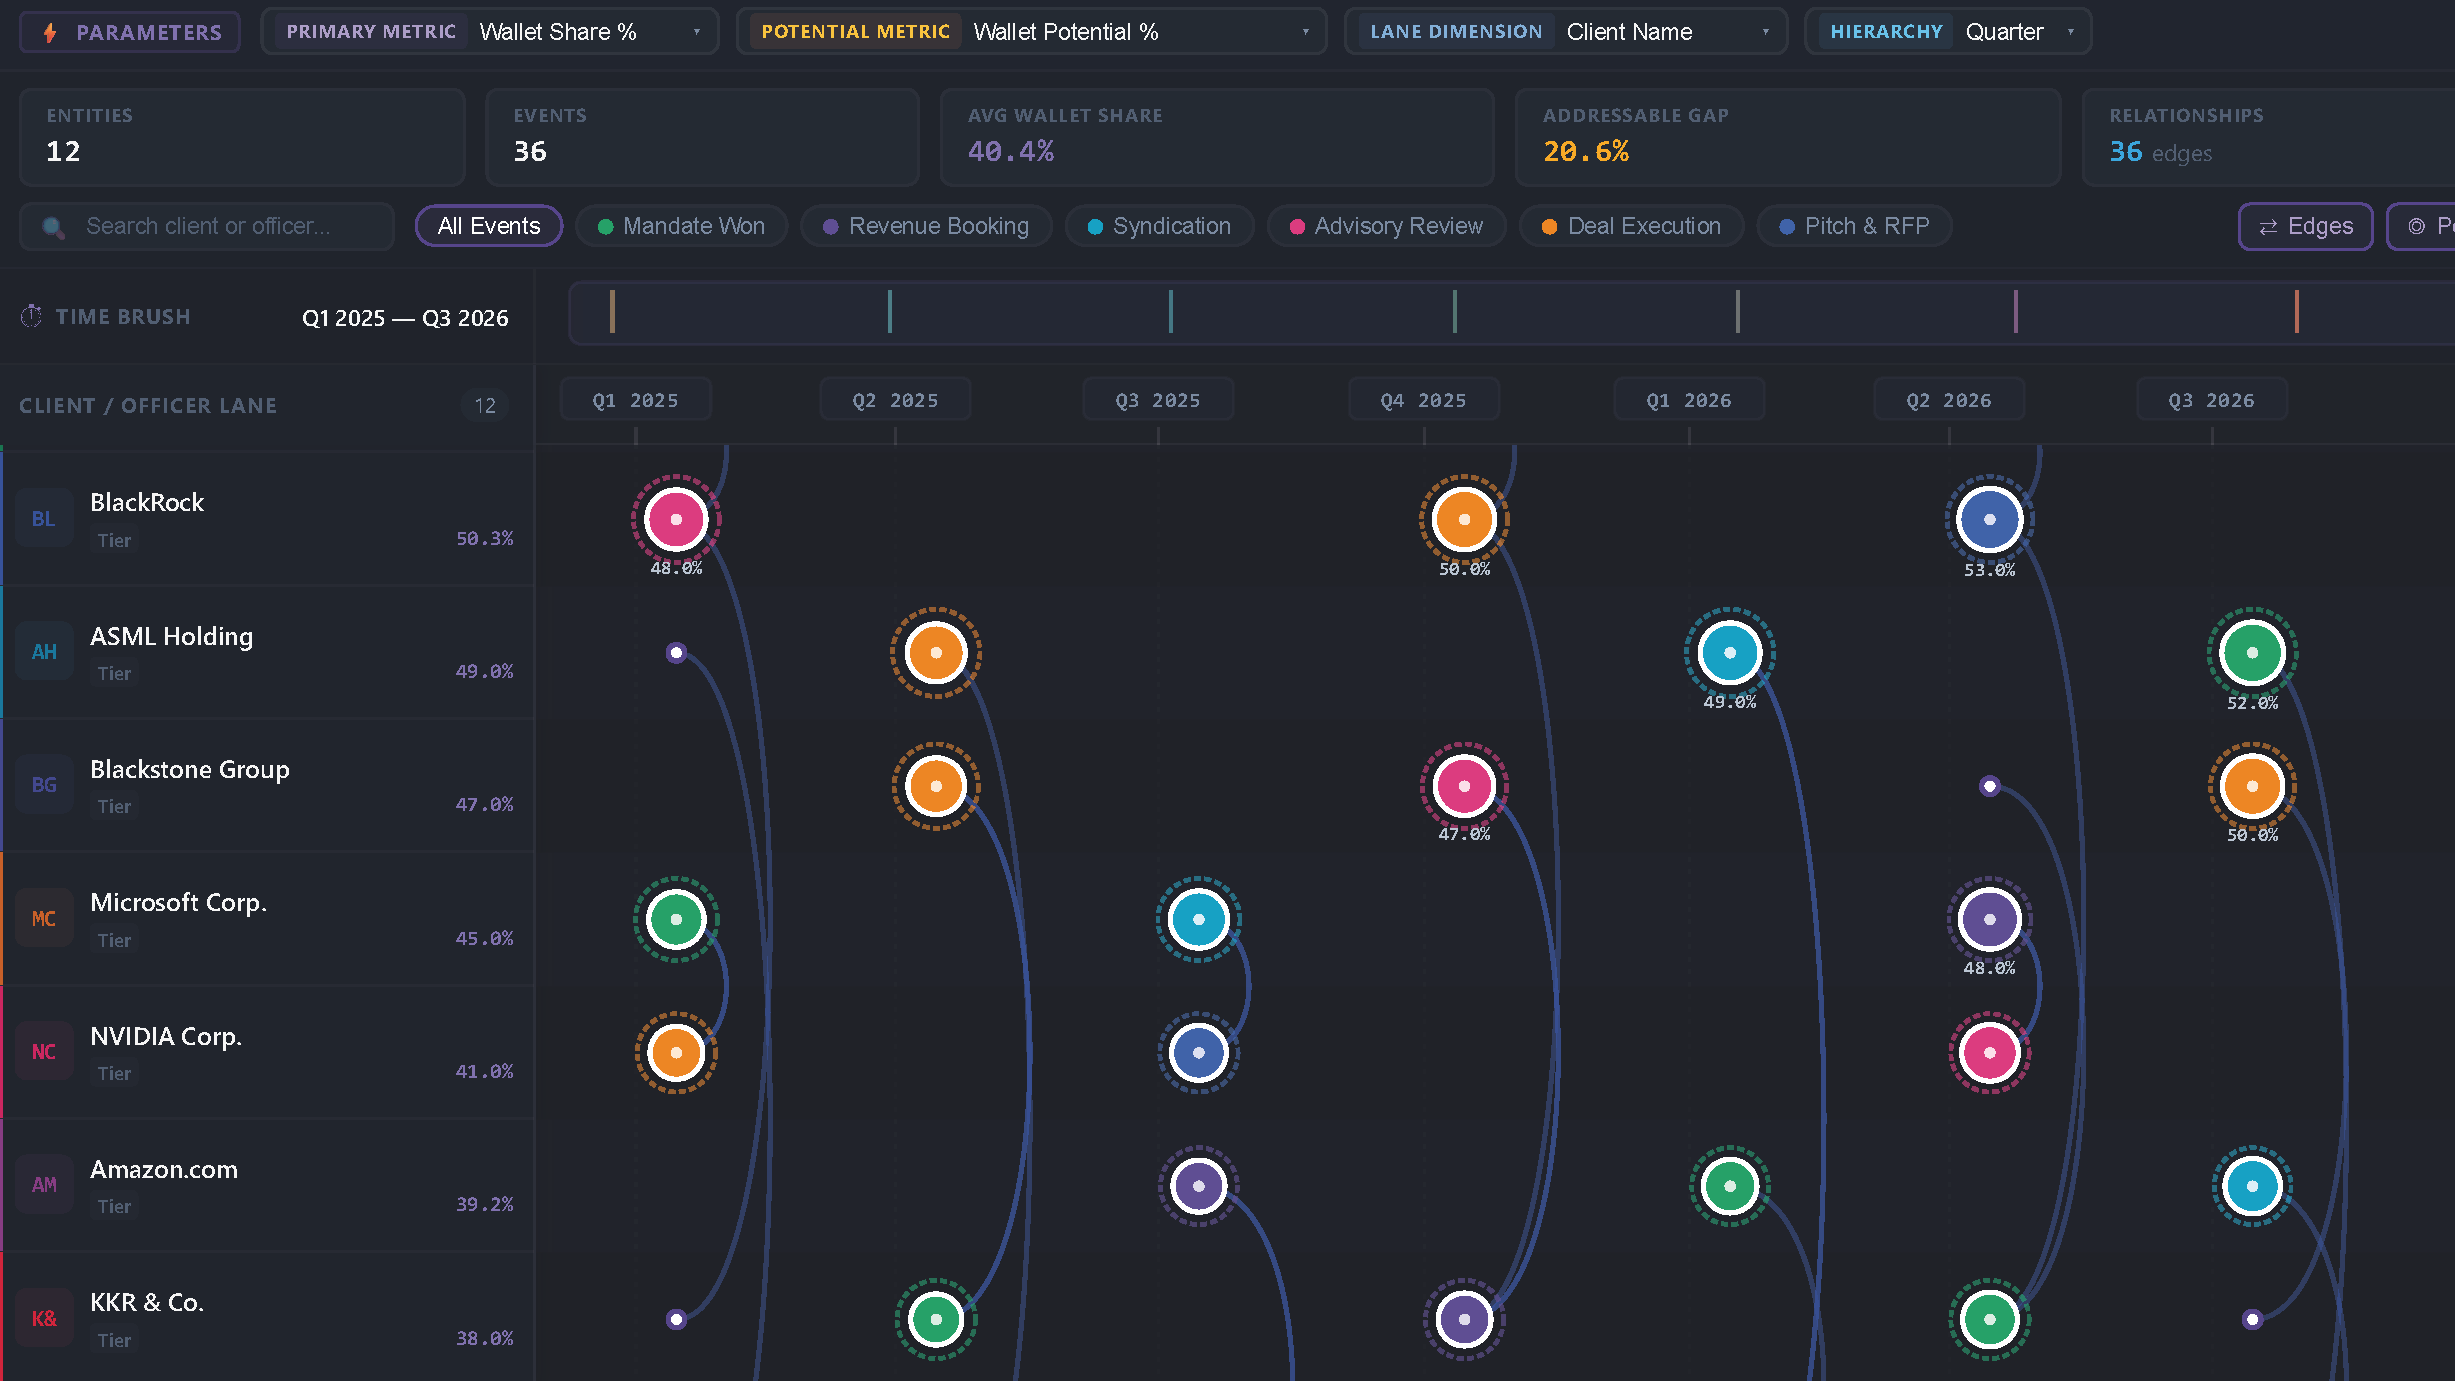
  • Synchronized Multi-Lane Swimlanes: Organizes accounts, coverage officers, or sectors along a unified chronological timeline.
  • Wallet Share & Potential Halos: Milestone nodes display deal type colors, inner wallet share fill, and outer dashed addressable potential gap rings.
  • Cross-Lane Network Overlays: Directed bezier curves connect lead clients with counterparties and syndicate co-managers.
  • Dynamic Field Parameter Dropdowns: Live swapping of dates, hierarchy levels, lane dimensions, and financial metrics directly from toolbar controls.
  • Interactive Executive Controls: Drag-and-pan time brush ribbon, real-time client search, quick milestone filters, and deep-dive drawer inspection.

These features provide investment banking coverage teams with unprecedented visibility into client engagement, deal execution, and wallet share expansion.

Conclusion

In conclusion, the Client Coverage & Wallet Share Network Timeline brings institutional-grade clarity to corporate relationship management and capital markets deal pipelines. By merging horizontal swimlane timelines, wallet share and potential halo analytics, cross-lane relationship networks, dynamic field parameters, and deep-dive inspection into a single responsive visual, it empowers executives and dealmakers to identify revenue gaps, coordinate co-coverage, and drive wallet growth in Power BI.

Key Features:

  1. Multi-Lane Chronological Timeline:

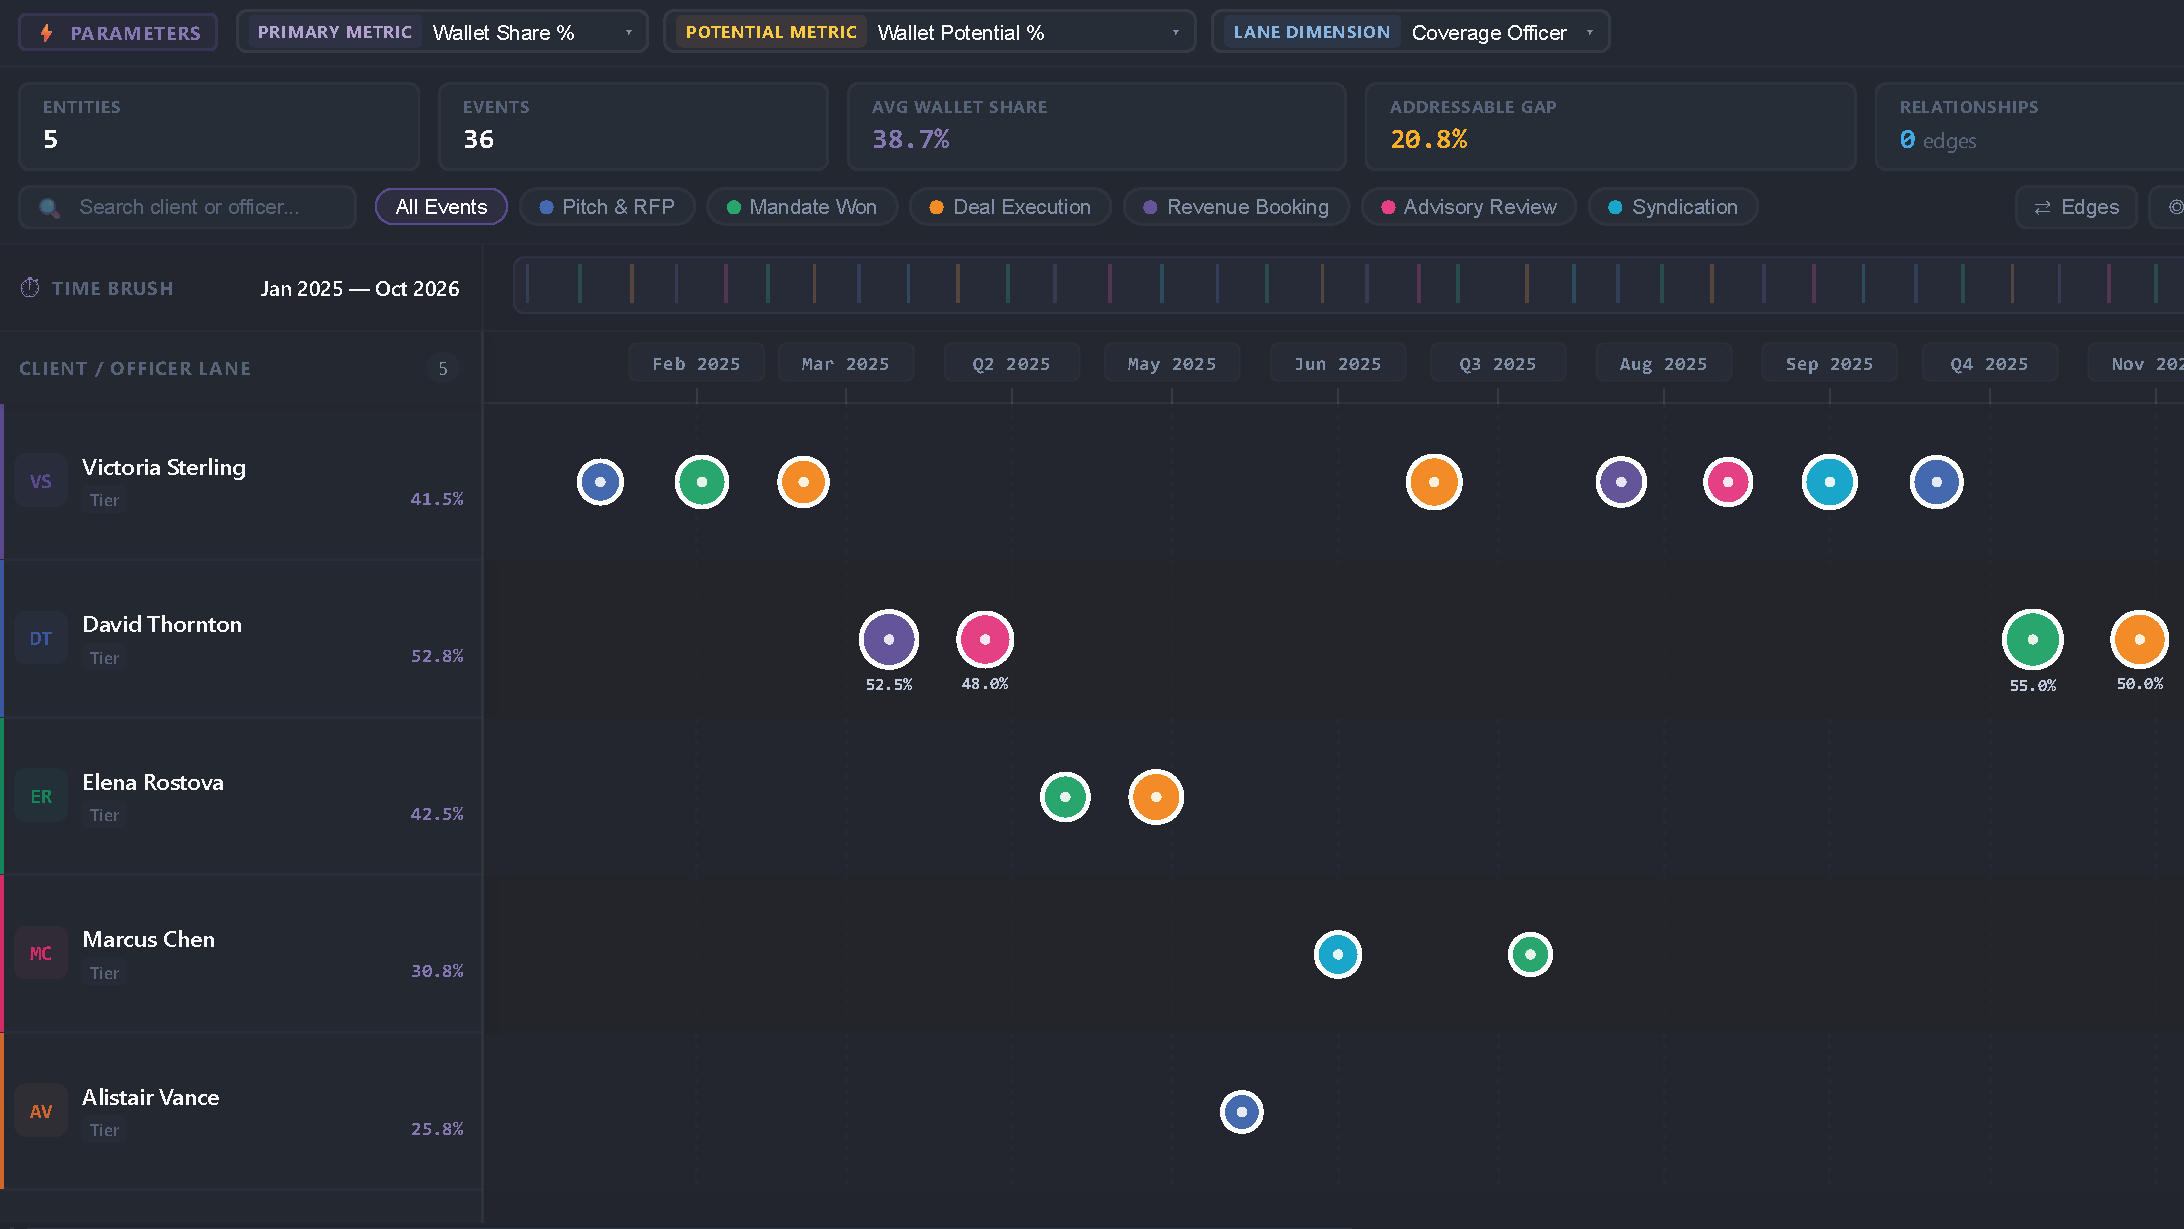
    • Parallel horizontal swimlanes organize coverage entities by Client Name, Coverage Officer, or Sector across a multi-year date axis.
  2. Wallet Share & Potential Gap Halos:

    • Nodes illustrate deal type status, realized wallet share %, and outer dashed halo rings representing untapped addressable potential.
  3. Cross-Lane Relationship Curves (Edges):

    • Smooth bezier curves trace syndication co-managers, counterparties, and partner connections crossing between lanes.
  4. Dynamic Field Parameter Controls:

    • Toolbar dropdowns allow live switching of Date fields (with Year/Quarter/Month/Day hierarchy levels), Lane dimensions, Wallet measures, and Product groups.
  5. Interactive Time Brush Ribbon:

    • Interactive slider track at the top of the canvas enables smooth zooming, panning, and filtering across chronological windows.
  6. Instant Search & Milestone Filter Pills:

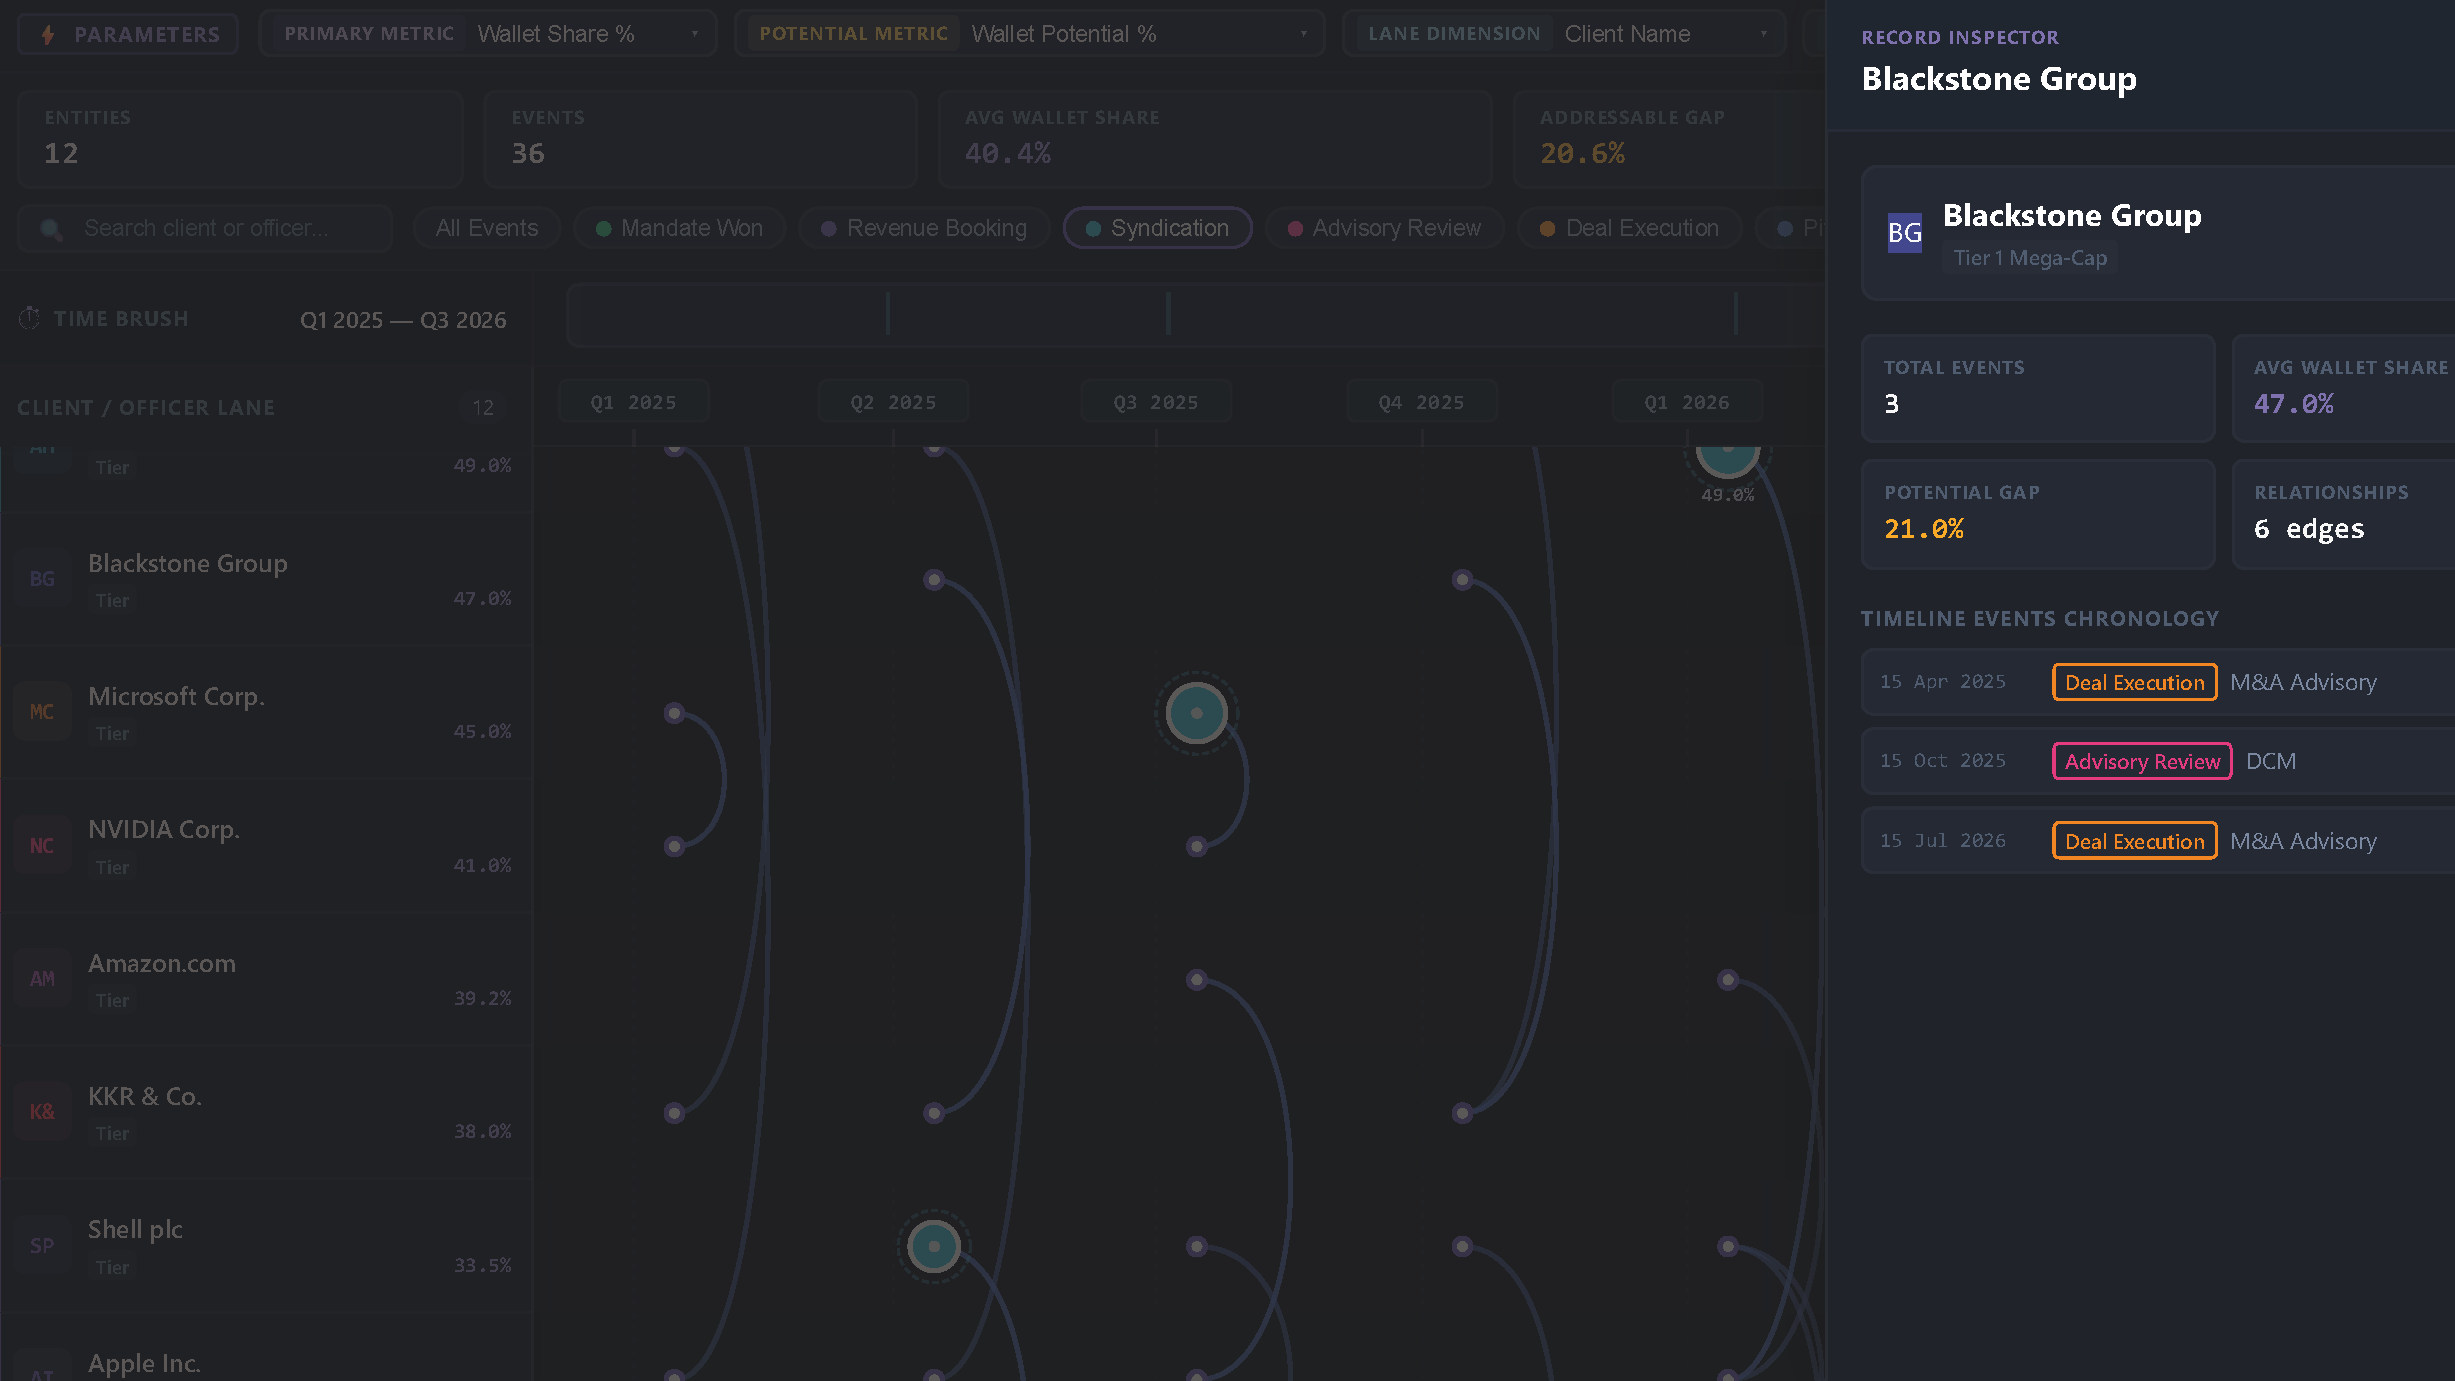
    • Quick search box for client or officer names and one-click milestone pills (Mandate Won, Pitch & RFP, Syndication, etc.) with instant reset.
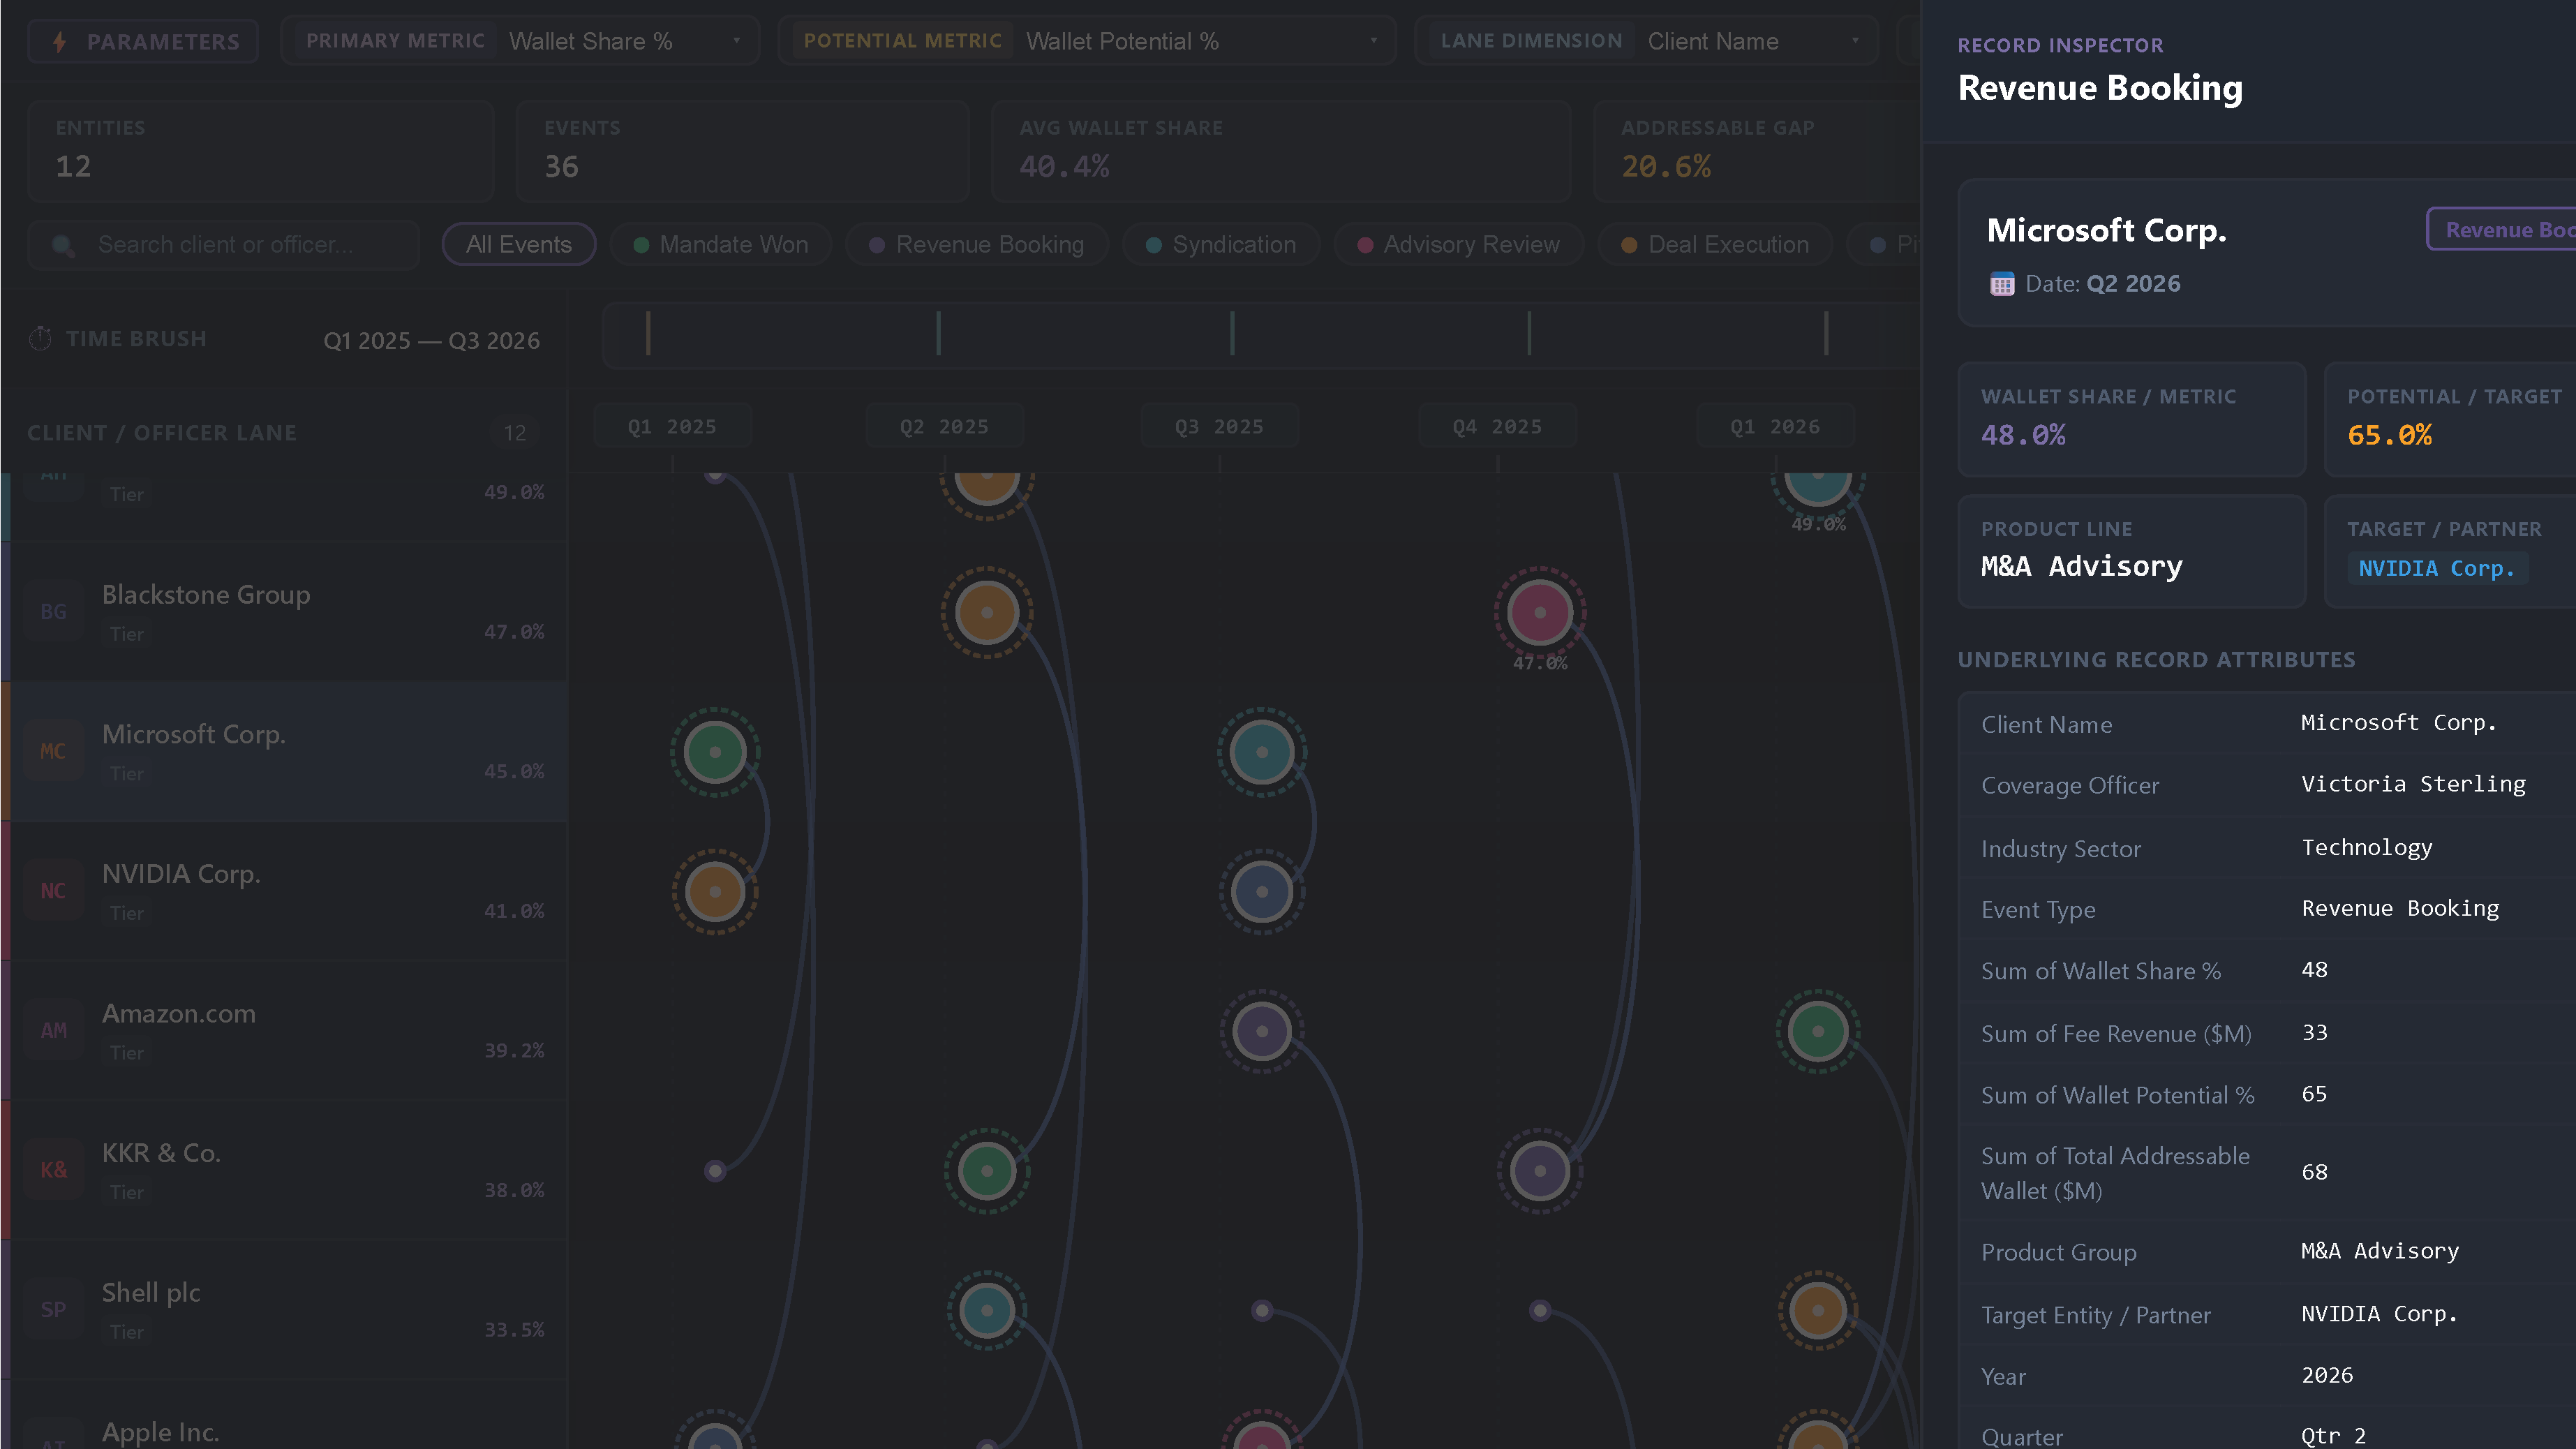
  7. Contextual Record Inspector Drawer:

    • Slide-out detail panel revealing comprehensive transaction metadata, financial metrics, and counterparty relationship graphs.
  8. Executive KPI Summary Cards:

    • Real-time KPI tiles for Total Events, Average Wallet Share %, Addressable Gap %, and Relationships count.

Other products

Office Solution Capacity Monitoring tool enables organizations to track Centrally:-

Magic Grid PBI Enterprise Solution

Power BI Magic grid which allows Write back into the database, ML Capa

Cohort Chart

Cohort Chart

Lorenz Curve Chart

Lorenz Curve by Office Solution

T

POWER BI LOAD TESTING SOLUTION

POWER BI LOAD TESTING SOLUTION

Line With Bubble Chart


Dynamic Price Elasticity Heat Map

Dynamic Price Elasticity Heat Map

Icon Array Chart

Icon Array Chart by office solution transforms traditional data repres
Multi-Book Risk Surface