Tool Is Certified by Microsoft:


For more information visit our Microsoft app source link https://appsource.microsoft.com/en-ca/product/power-bi-visuals/officesolution1640276900203.custom-slicer-by-office-solution?tab=Overview
Office Solution Capacity Monitoring tool enables organizations to track Centrally:-
Dynamic Price Elasticity Heat Map
Power BI Magic grid which allows Write back into the database, ML Capa
Empower users with dynamic bar charts, allowing real-time numeric aggr
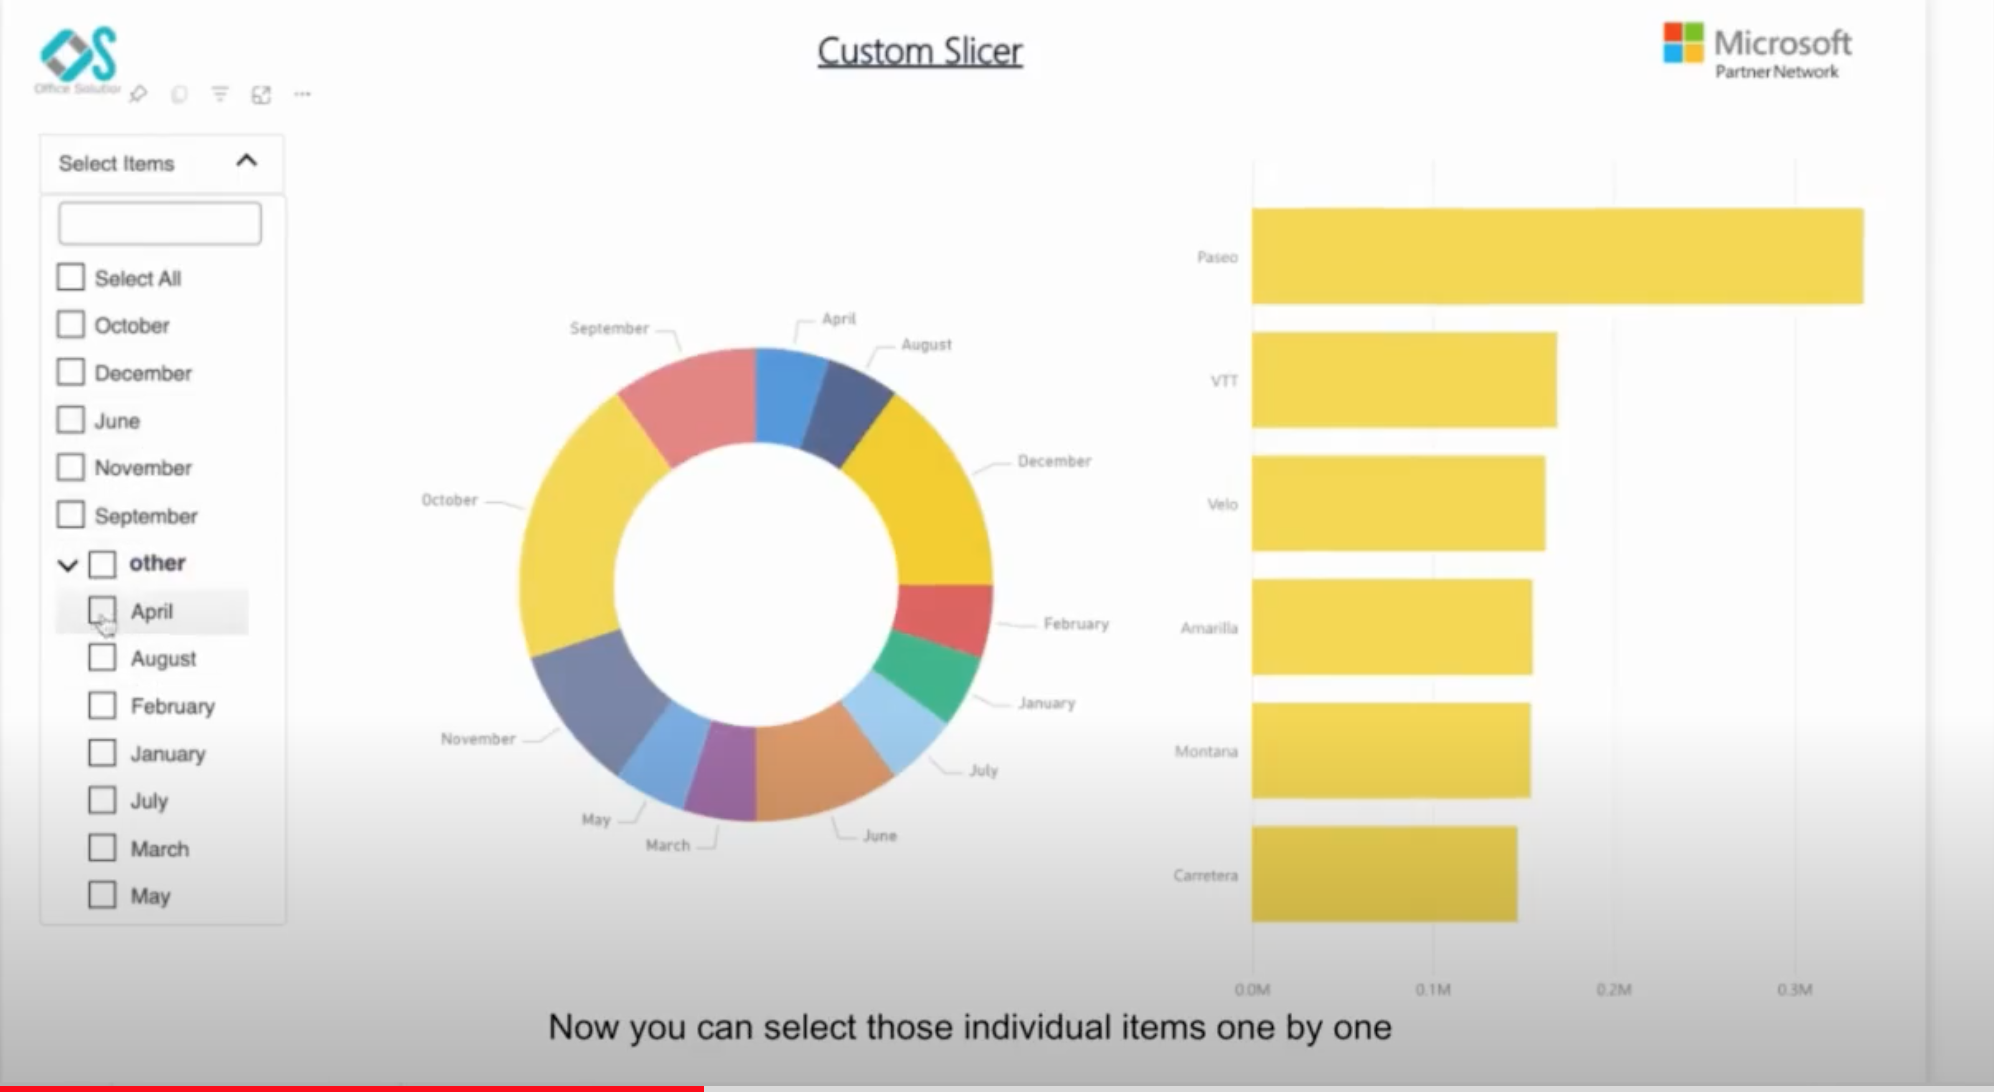
Select Top N number of items to be displayed in chart and rest items w
Power BI Premium Capacity Analytics Solution Reduce your Power BI prem