Product Detail

Deal Pipeline Contribution Tree

Tool Is Certified by Microsoft:

Problem Statement

In complex deal pipeline management—particularly across Investment Banking, M&A, Private Equity, and Enterprise B2B Sales—decision-makers struggle to understand true expected value and pipeline velocity across multi-tier hierarchies. Common challenges include:

  1. Lack of Probability Weighting in Hierarchy Trees: Traditional pipeline hierarchy charts display simple aggregated sums without factoring in stage win probabilities, giving an unrealistic assessment of expected revenue or advisory fees.

  2. Disjointed Variance & Budget Tracking: Analysts must navigate multiple disconnected visuals to view budget targets against weighted pipeline forecasts, lacking inline variance coloring embedded directly within tree nodes.

  3. Cognitive Overload from Deep Mandates: Exploring extensive pipelines with hundreds of mandates creates overwhelming visual clutter, with no streamlined mechanism to isolate top contributors while cleanly rolling up residual deals into an "Other" category.

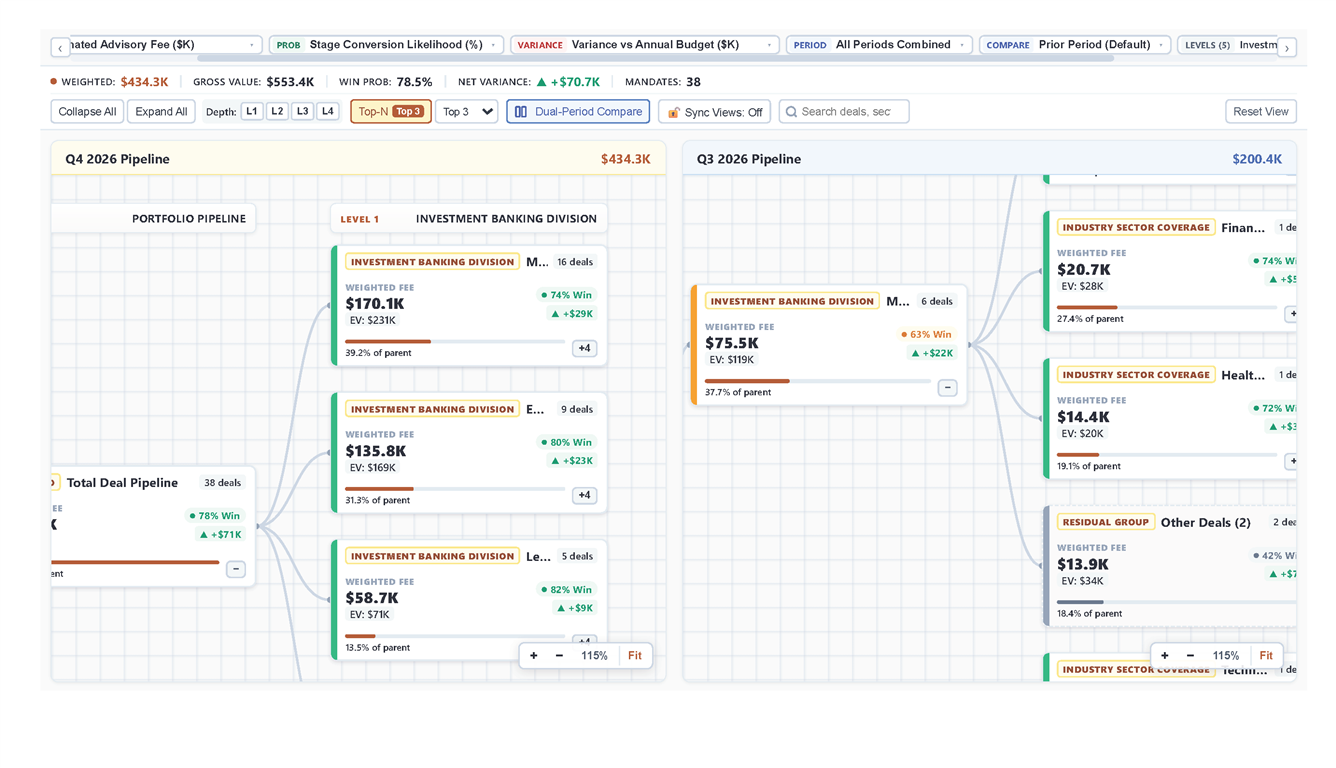
  4. Inability to Track Deal Drift Across Periods: Evaluating period-over-period pipeline progression (e.g., Q4 vs. Q3) typically requires cumbersome multi-tab report setups rather than side-by-side dual-period tree comparison.

The Deal Pipeline Contribution Tree addresses these challenges with specialized enterprise features:

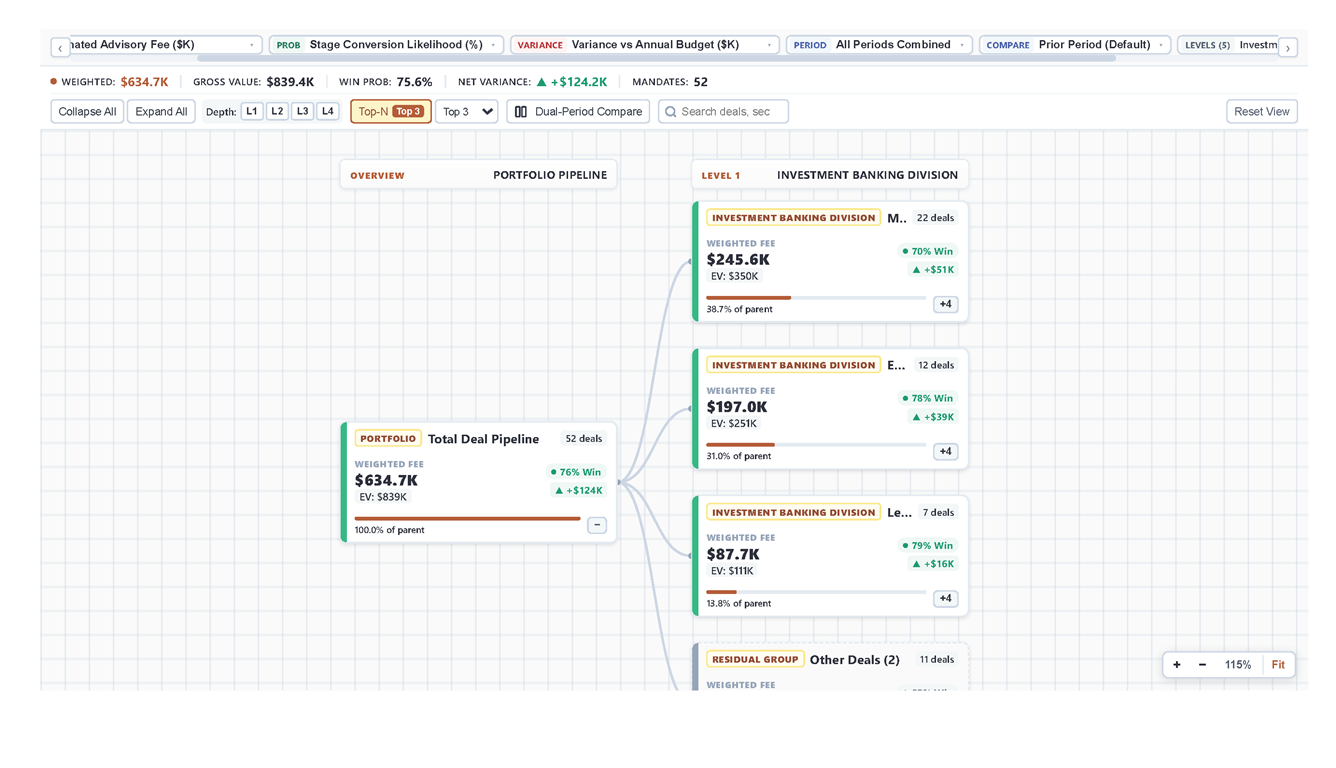
  • Probability-Weighted Contribution Nodes: Cards displaying weighted advisory fee/value, win likelihood percentage, enterprise value (EV), parent contribution percentage, and mini progress gauges.
  • Inline Budget Variance Highlighting: Automatic positive and negative color cues with delta variance indicators.
  • Top-N + Residual "Other" Rollup: Automatic focus on high-impact deals while dynamically consolidating smaller mandates into an expandable residual node.
  • Dual-Period Comparative Analysis: Side-by-side tree layout for seamless period-over-period deal drift and velocity tracking.
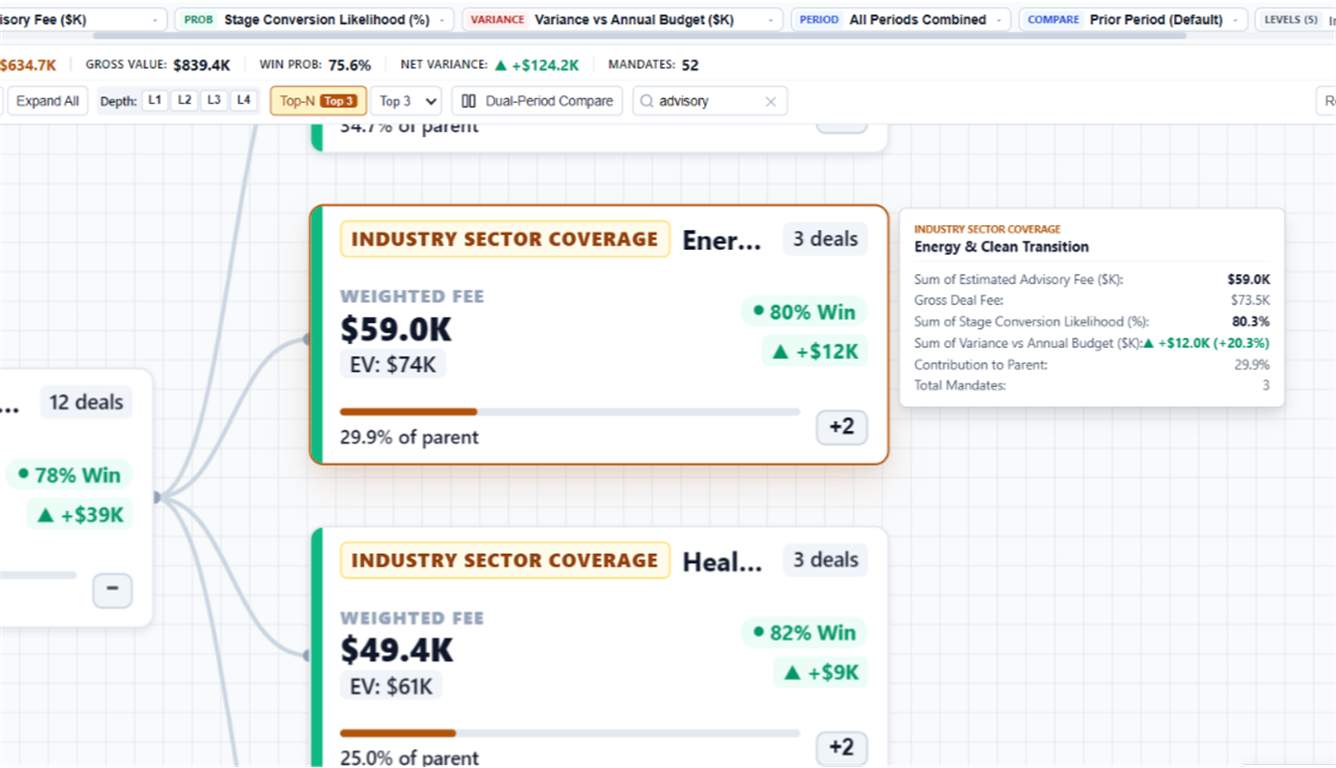
  • Interactive Navigation & Filtering: Live deal search bar, quick depth selectors (L1–L4), smooth pan-and-zoom controls, and expand/collapse toggles.

These capabilities empower dealmakers and FP&A leaders to pinpoint high-probability opportunities, monitor pipeline leakages, and forecast fee realization with unmatched precision.

Conclusion

In conclusion, the Deal Pipeline Contribution Tree delivers a purpose-built visual for investment banking, private equity, and enterprise sales analytics. By marrying multi-tier pipeline contribution trees with probability-weighted valuation and dual-period comparative analysis, it replaces fragmented reports with an interactive, end-to-end pipeline intelligence map. Leaders can instantly pinpoint revenue drivers, track pipeline health against annual targets, and present boardroom-ready insights in Power BI.

Key Features:

  1. Multi-Tier Pipeline Contribution Tree:

    • Multi-tier horizontal drilldown from total portfolio root down to divisions, sectors, and individual transaction mandates.
  2. Probability-Weighted Valuation:

    • Calculates weighted expected fees alongside gross deal values using stage conversion likelihoods.
  3. Variance & Budget Tracking:

    • Automated positive (green) and negative (red) delta indicators embedded within nodes compare pipeline health against annual budgets.
  4. Dual-Period Compare Mode:

    • Side-by-side comparison of two reporting periods (e.g., current vs. prior quarter) to evaluate pipeline velocity and deal progression.
  5. Top-N + Residual "Other" Grouping:

    • Focus on top contributors while cleanly rolling up remaining deals into an interactive "Other Deals" node to prevent visual clutter.
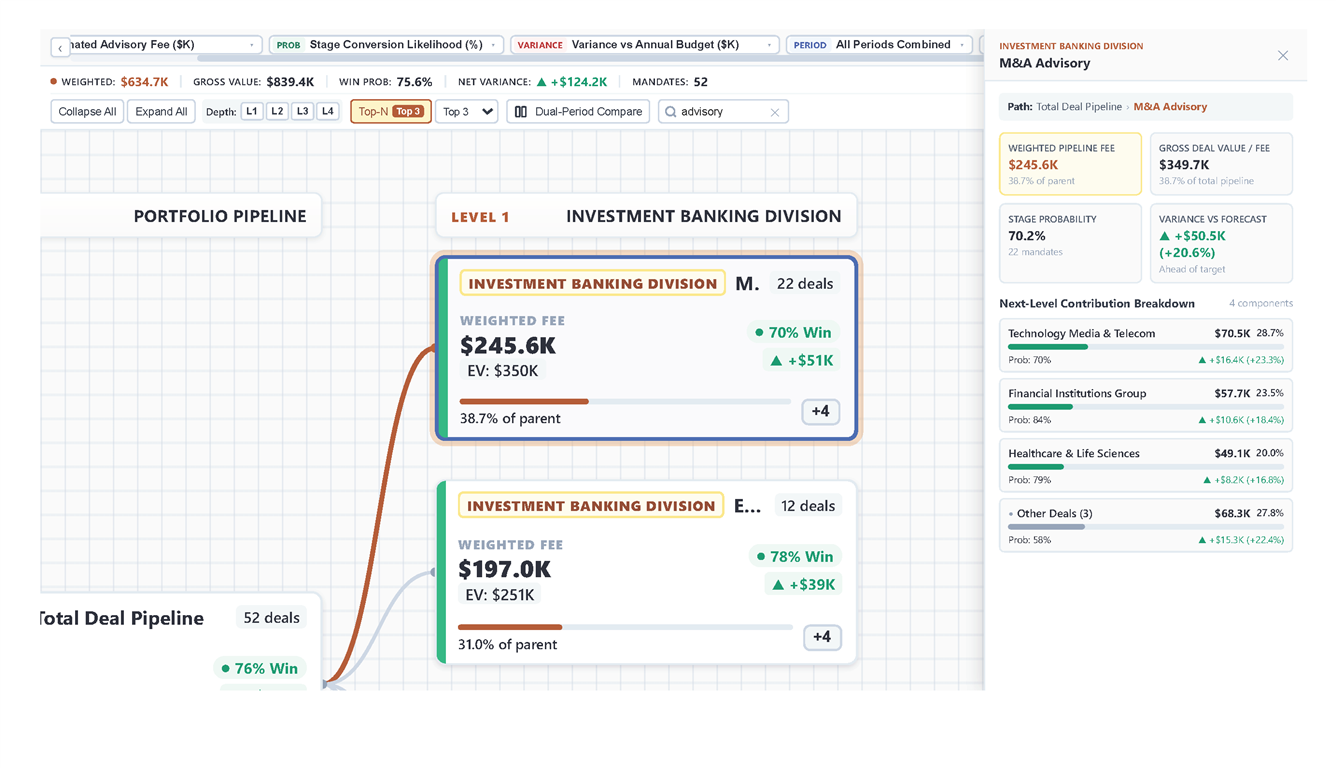
  6. Pipeline Deal Inspector Drawer:

    • Click any node to open an interactive side inspector displaying additive waterfall breakdowns, probability weighting, and underlying mandates.
  7. Report Cross-Filtering & Multi-Selection:

    • Full bidirectional cross-filtering with other Power BI visuals, complete with multi-selection support.
  8. Interactive Navigation & Search:

    • Live search bar to locate specific mandates, depth selectors (L1–L4), zoom/pan slider, and full-screen fit capabilities.

Other products

Office Solution Capacity Monitoring tool enables organizations to track Centrally:-

Deal Pipeline Contribution Tree

Cohort Chart

Cohort Chart

Financial Risk and Stock Risk Calculation

Hierarchical Decomposition Flow

Connected Scatter Plot chart

Connected Scatter Plot chart

Fishbone chart

The Fishbone Chart, also known as an Ishikawa or cause-and-effect diag

Relative Value & Spread Evolution Radar

Hanging Rootogram Chart

The Hanging Rootogram chart is an advanced statistical visualization t