Product Detail

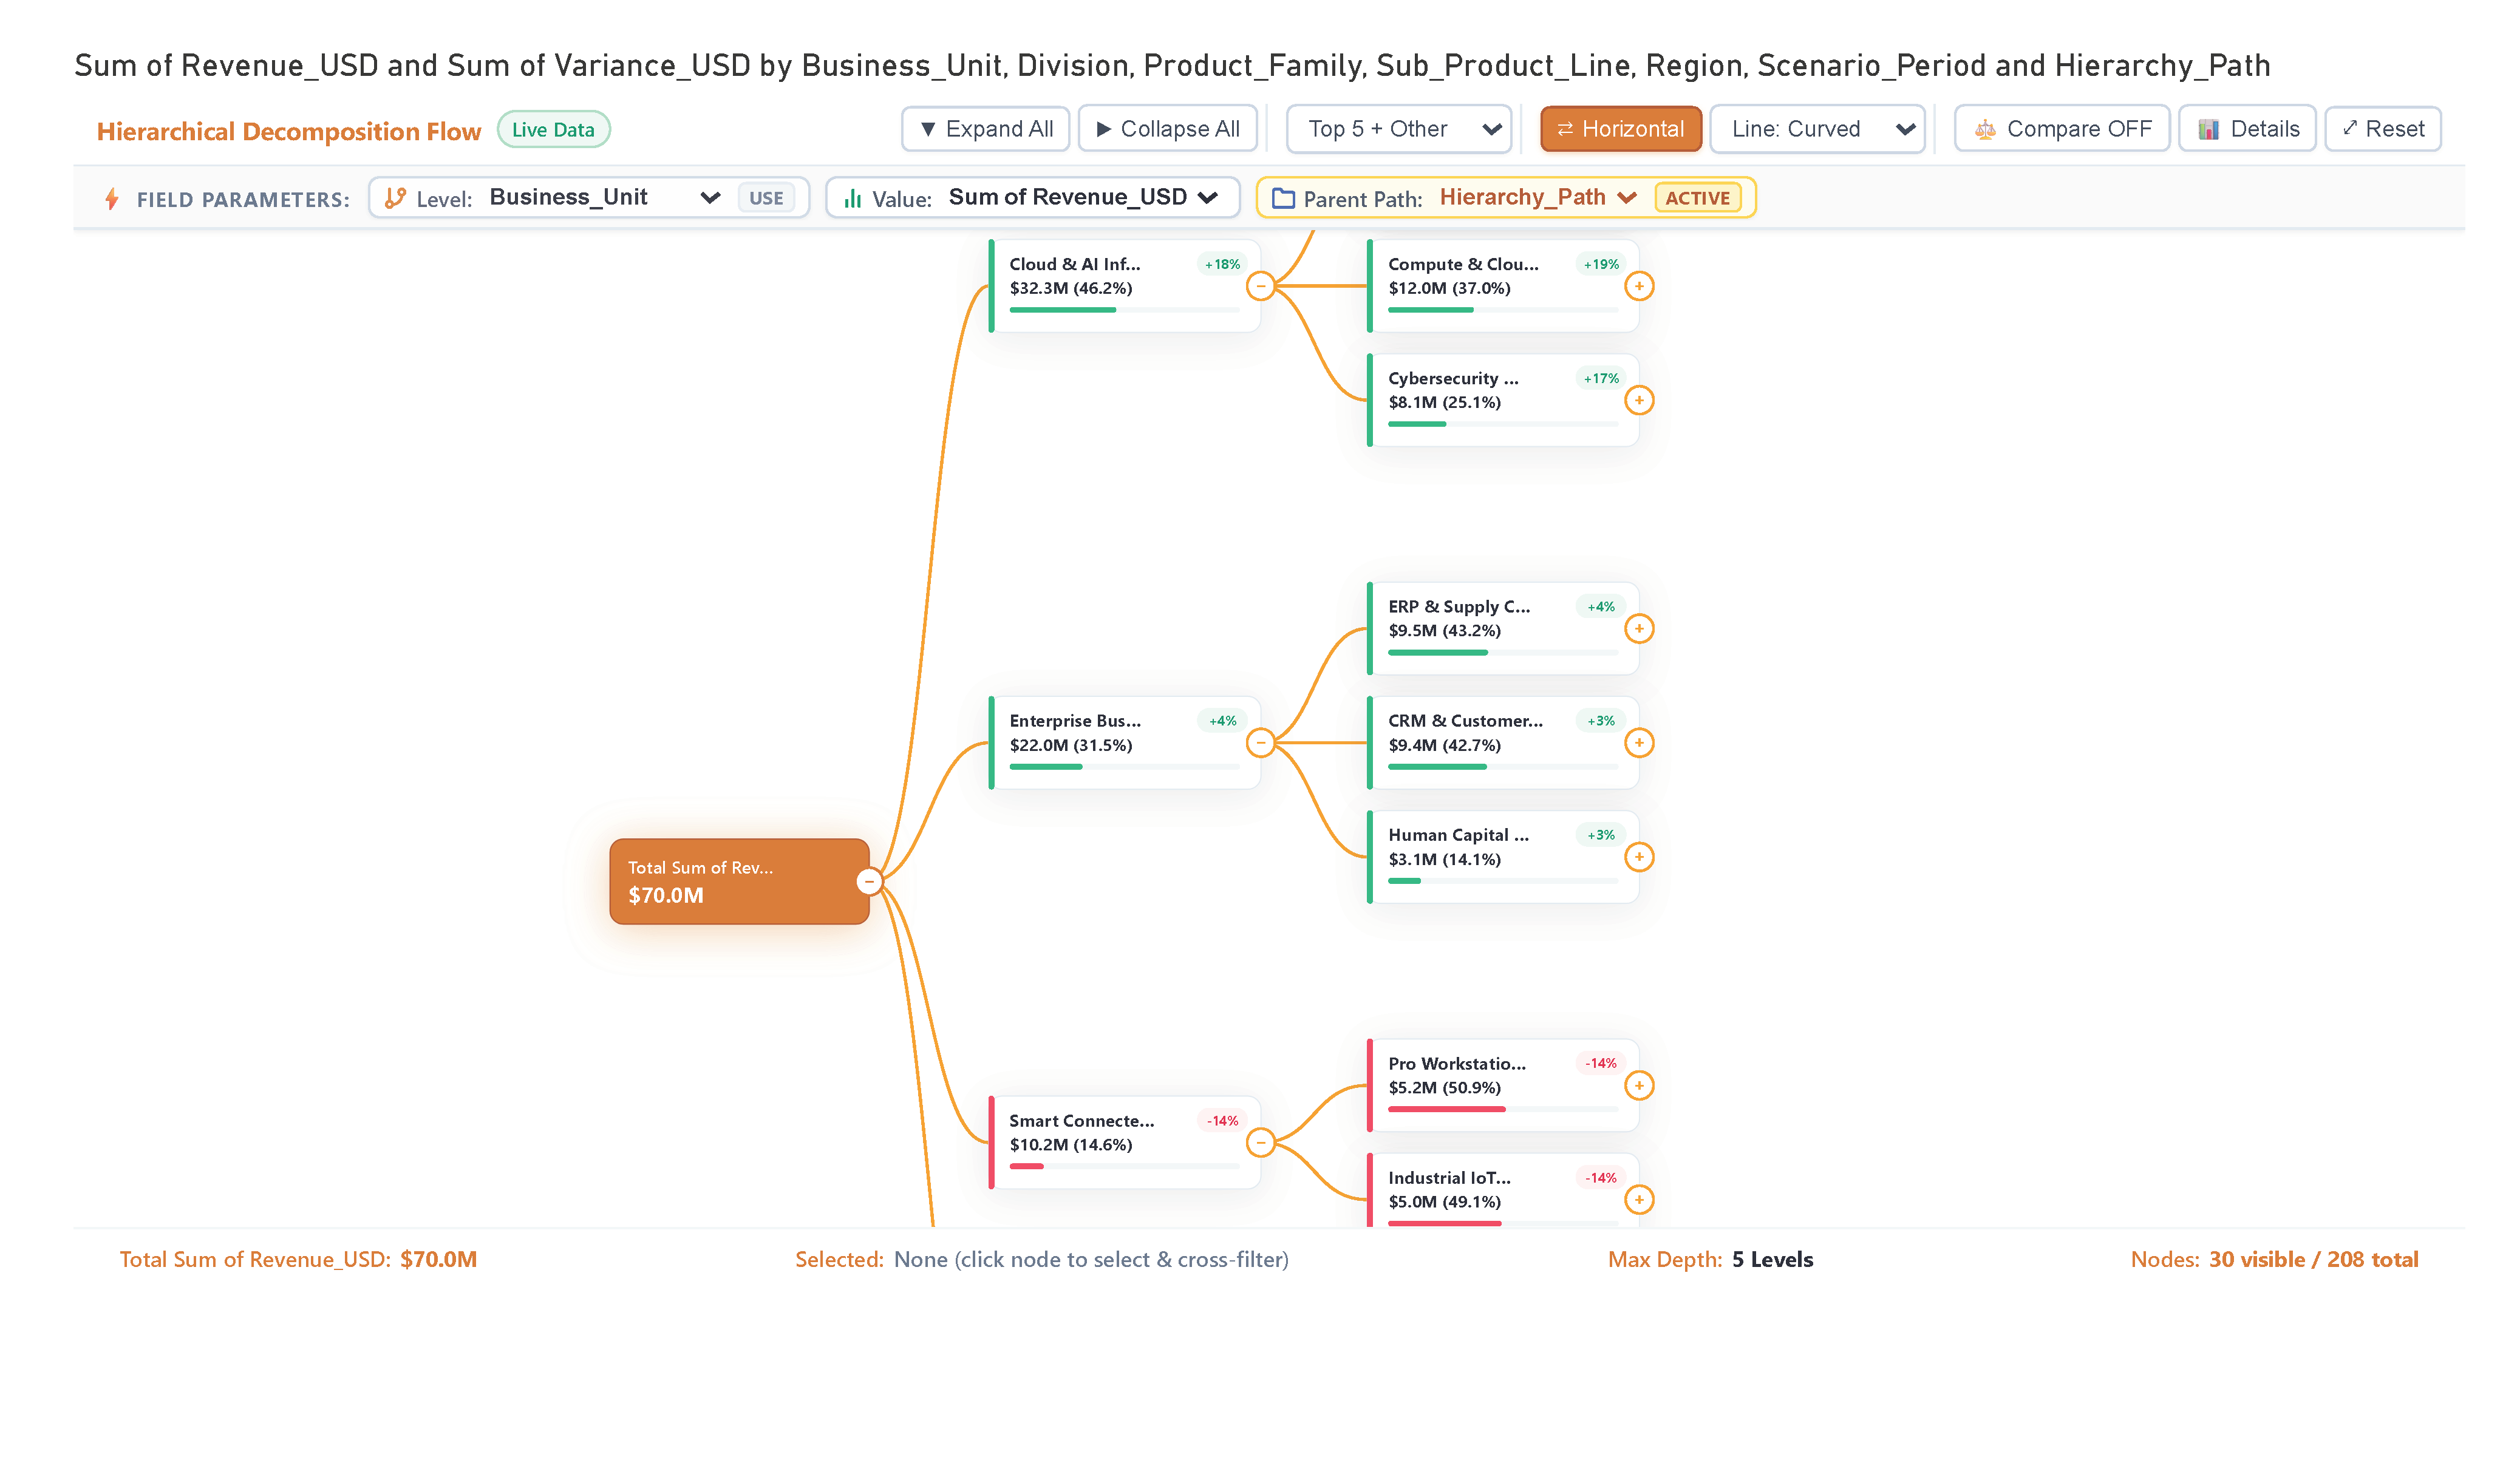
Hierarchical Decomposition Flow

Tool Is Certified by Microsoft:

Problem Statement

In complex data analysis, particularly within Finance and FP&A, users face challenges understanding root-cause contributions and variances across multiple hierarchical levels. Common issues include:

  1. Lack of Integrated Context: Standard decomposition trees fail to show the absolute contribution and percentage of parent simultaneously, making it hard to weigh the importance of different branches.

  2. Disjointed Variance Analysis: Users often have to use separate charts to view budget vs. actuals, lacking automated variance coloring embedded directly within the hierarchical breakdown.

  3. Data Clutter: Exploring deep hierarchies can lead to overwhelming amounts of data, with no easy way to filter top contributors while dynamically grouping the rest into an "Other" category.

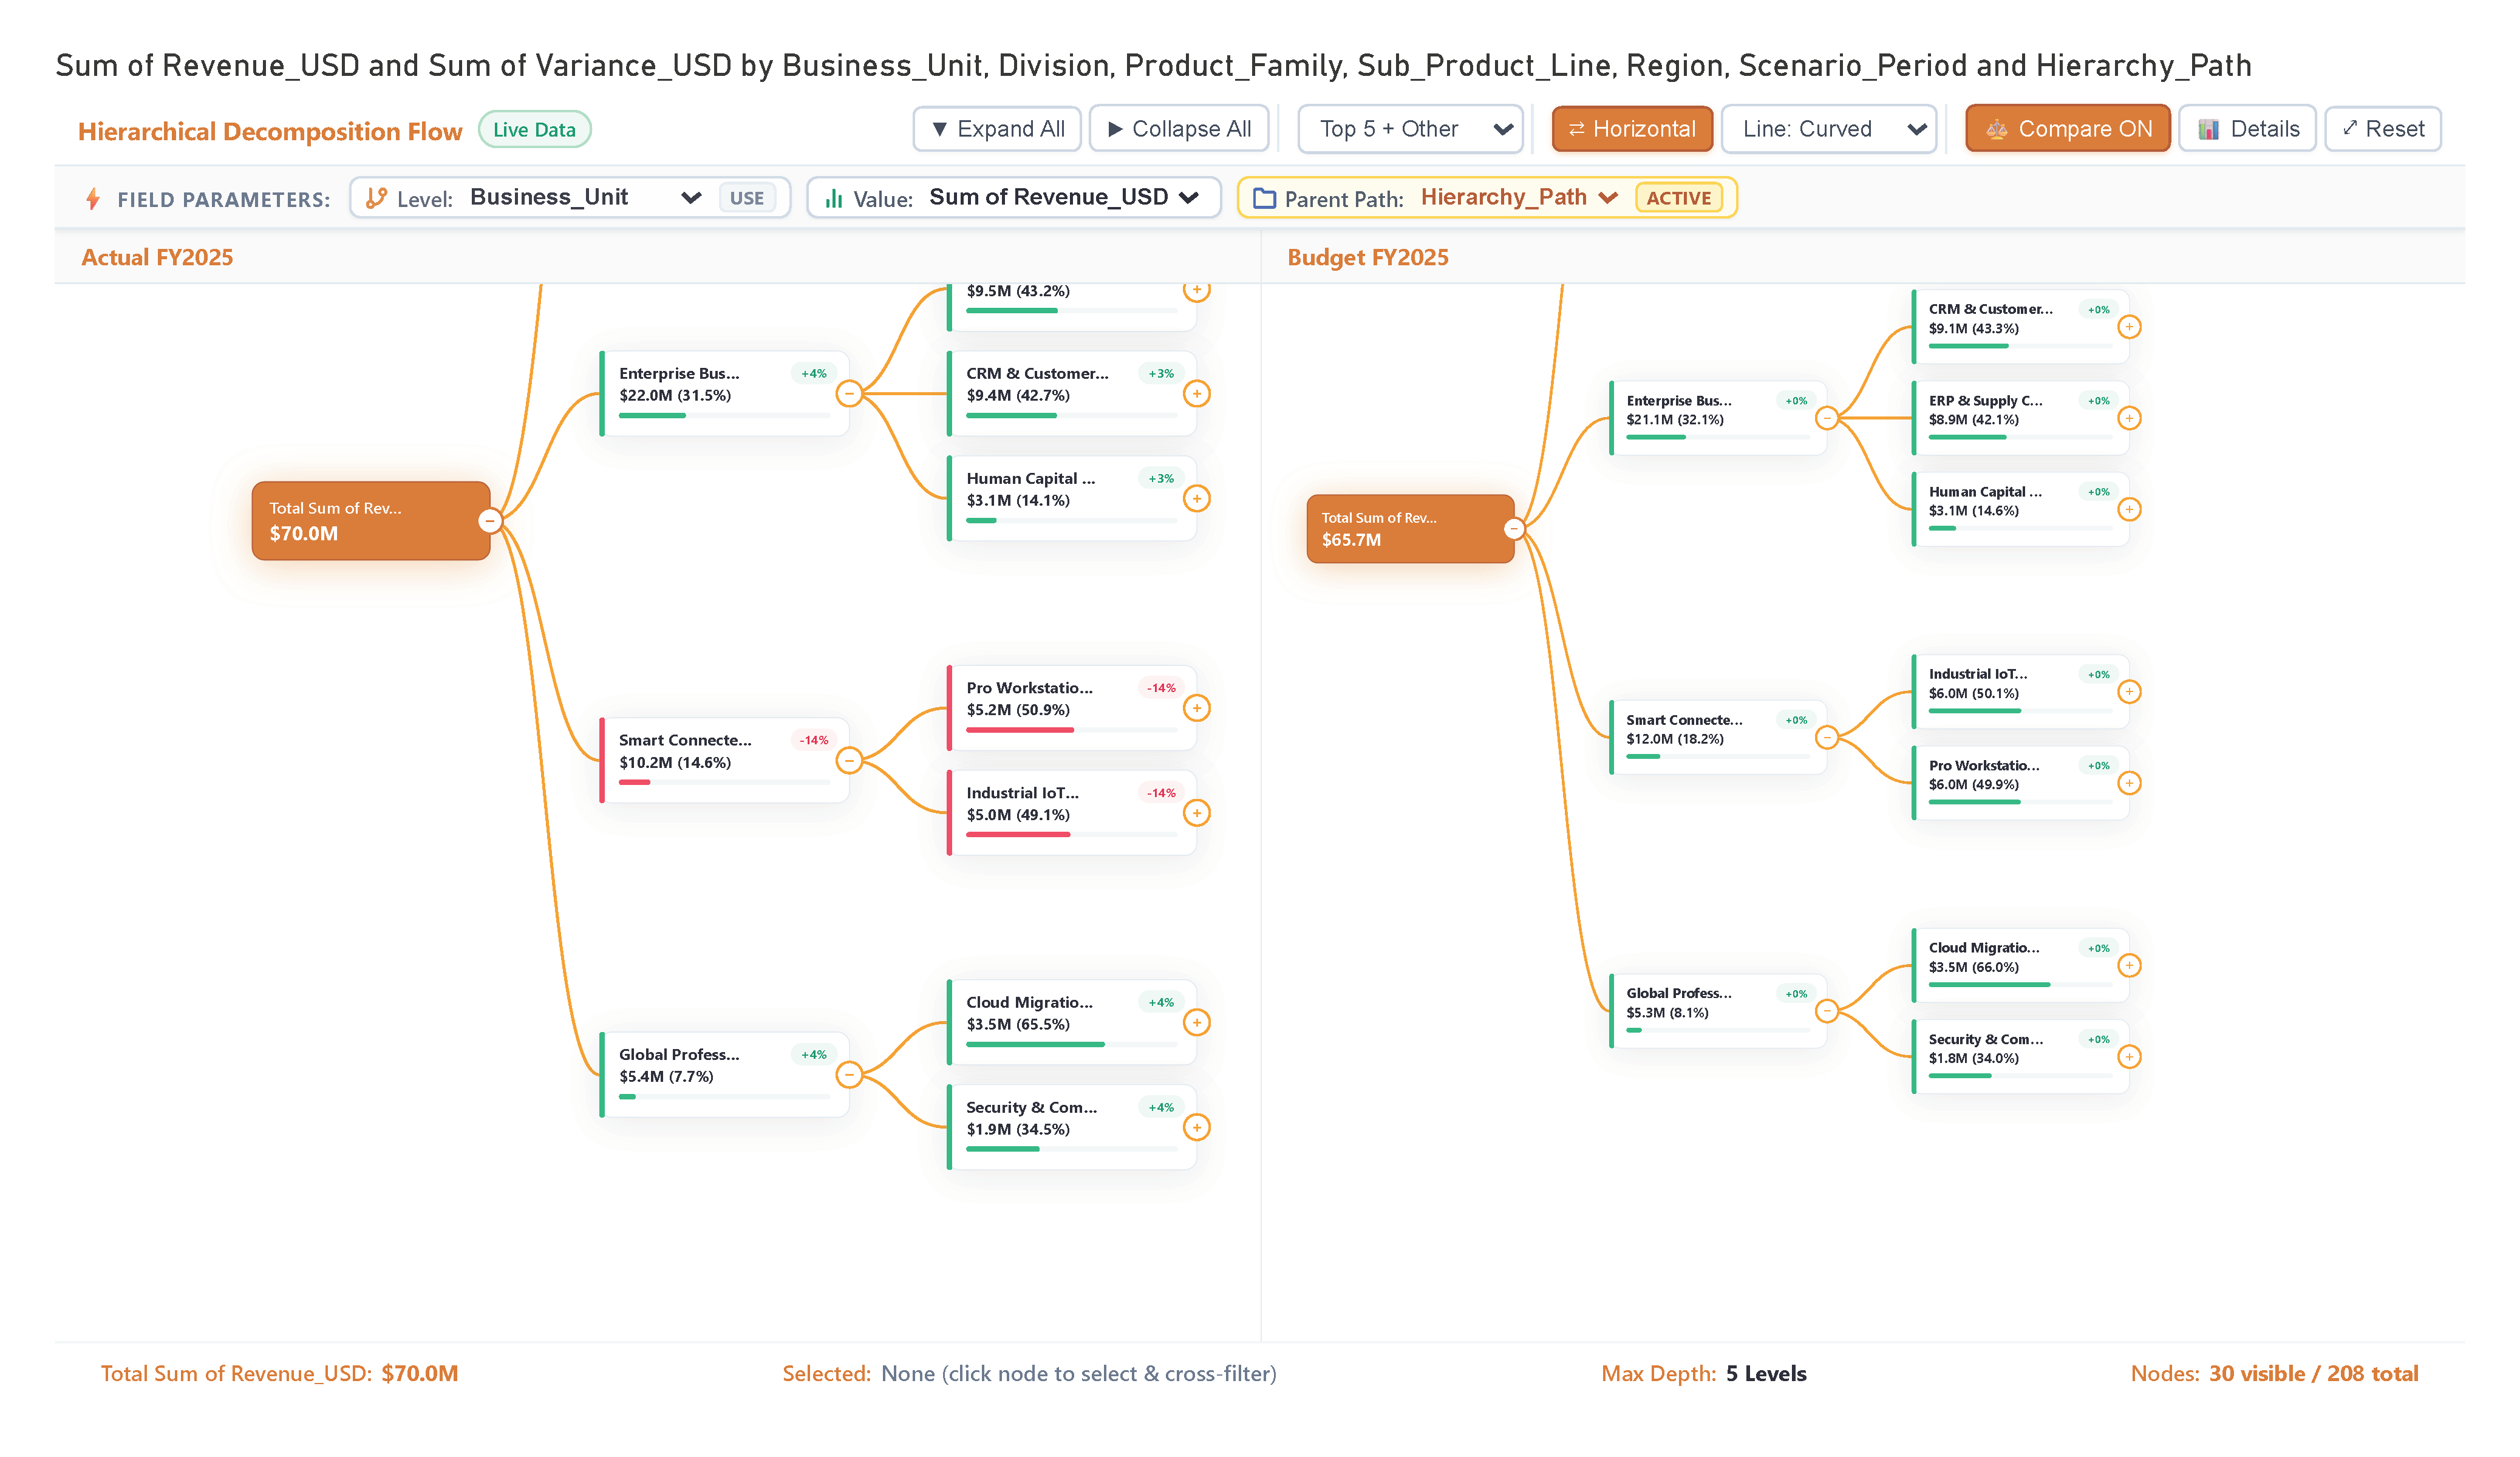
  4. Poor Comparative Capabilities: Side-by-side comparison of two periods or scenarios across an entire hierarchy is often impossible without custom, complex reporting setups.

The Hierarchical Decomposition Flow addresses these challenges by offering advanced features such as:

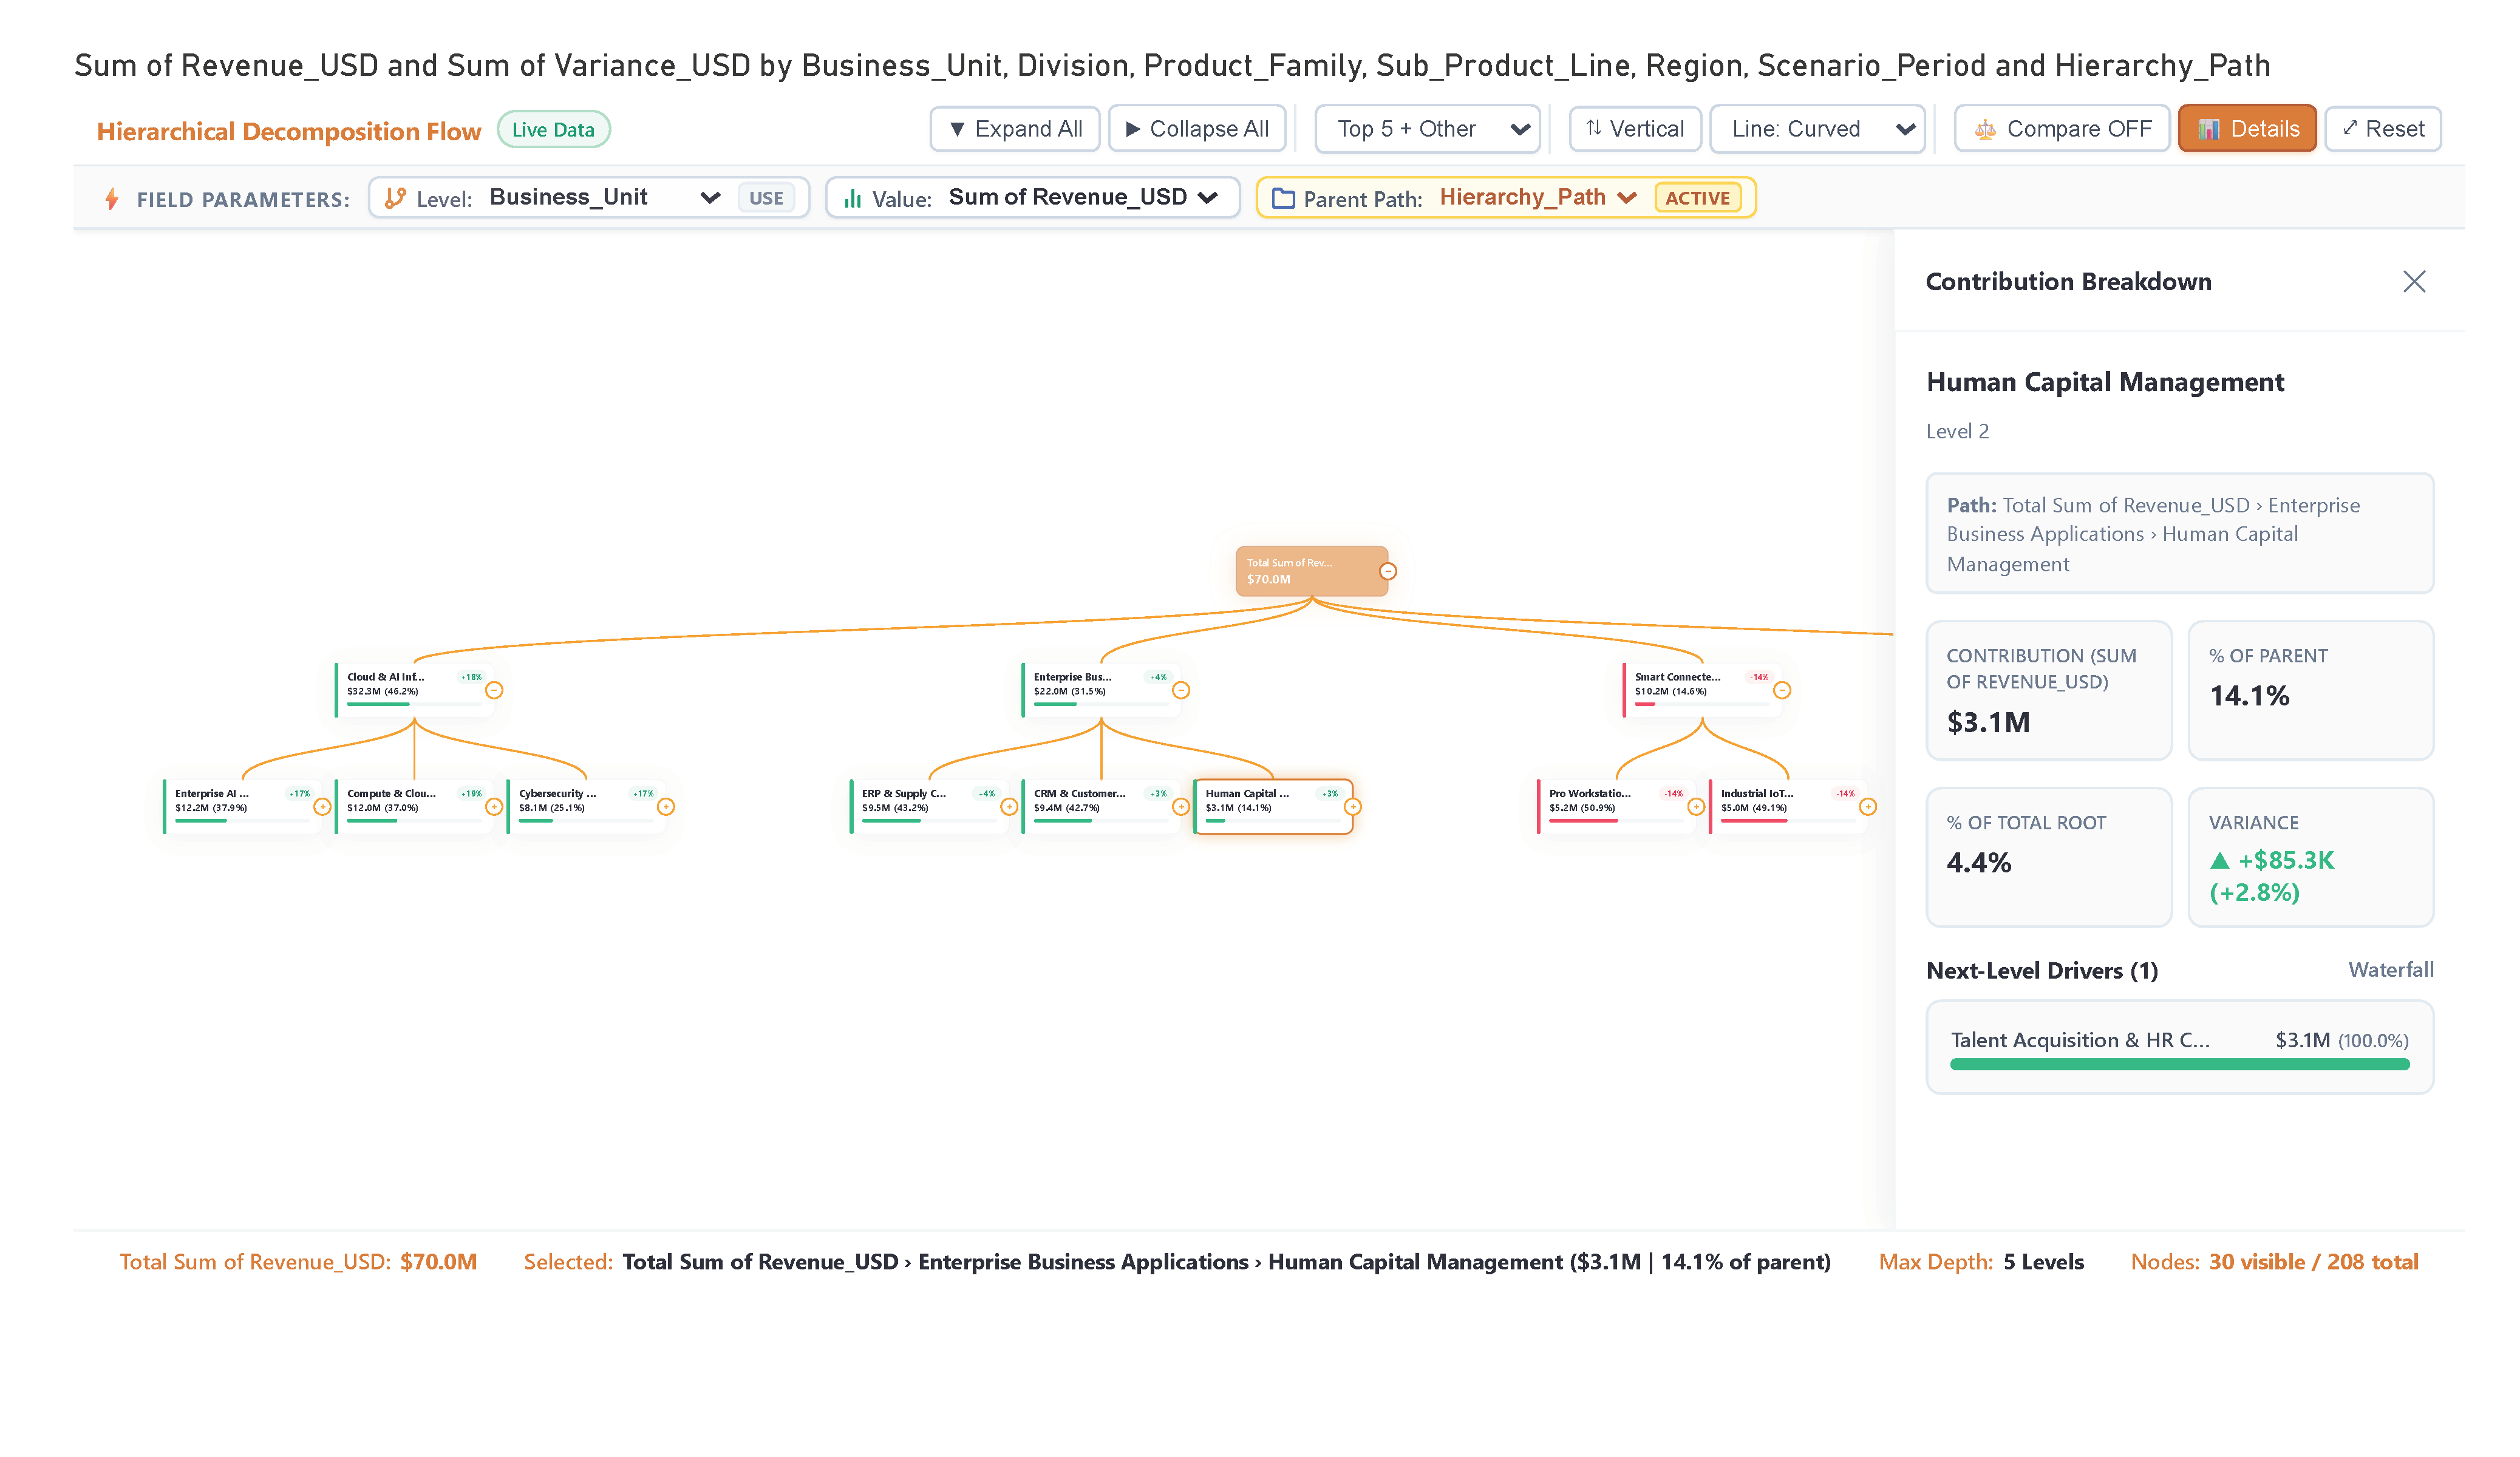
  • Contribution Waterfall Nodes: Cards displaying absolute contribution value, % of parent, % of total, and an embedded mini progress waterfall bar.
  • Variance-Based Coloring: Automated positive and negative coloring and variance percentage delta pills.
  • Top-N + Residual "Other" Grouping: Focus on top contributors with automatic residual summation.
  • Dual-Tree Compare Mode: Side-by-side comparison of two periods or scenarios.
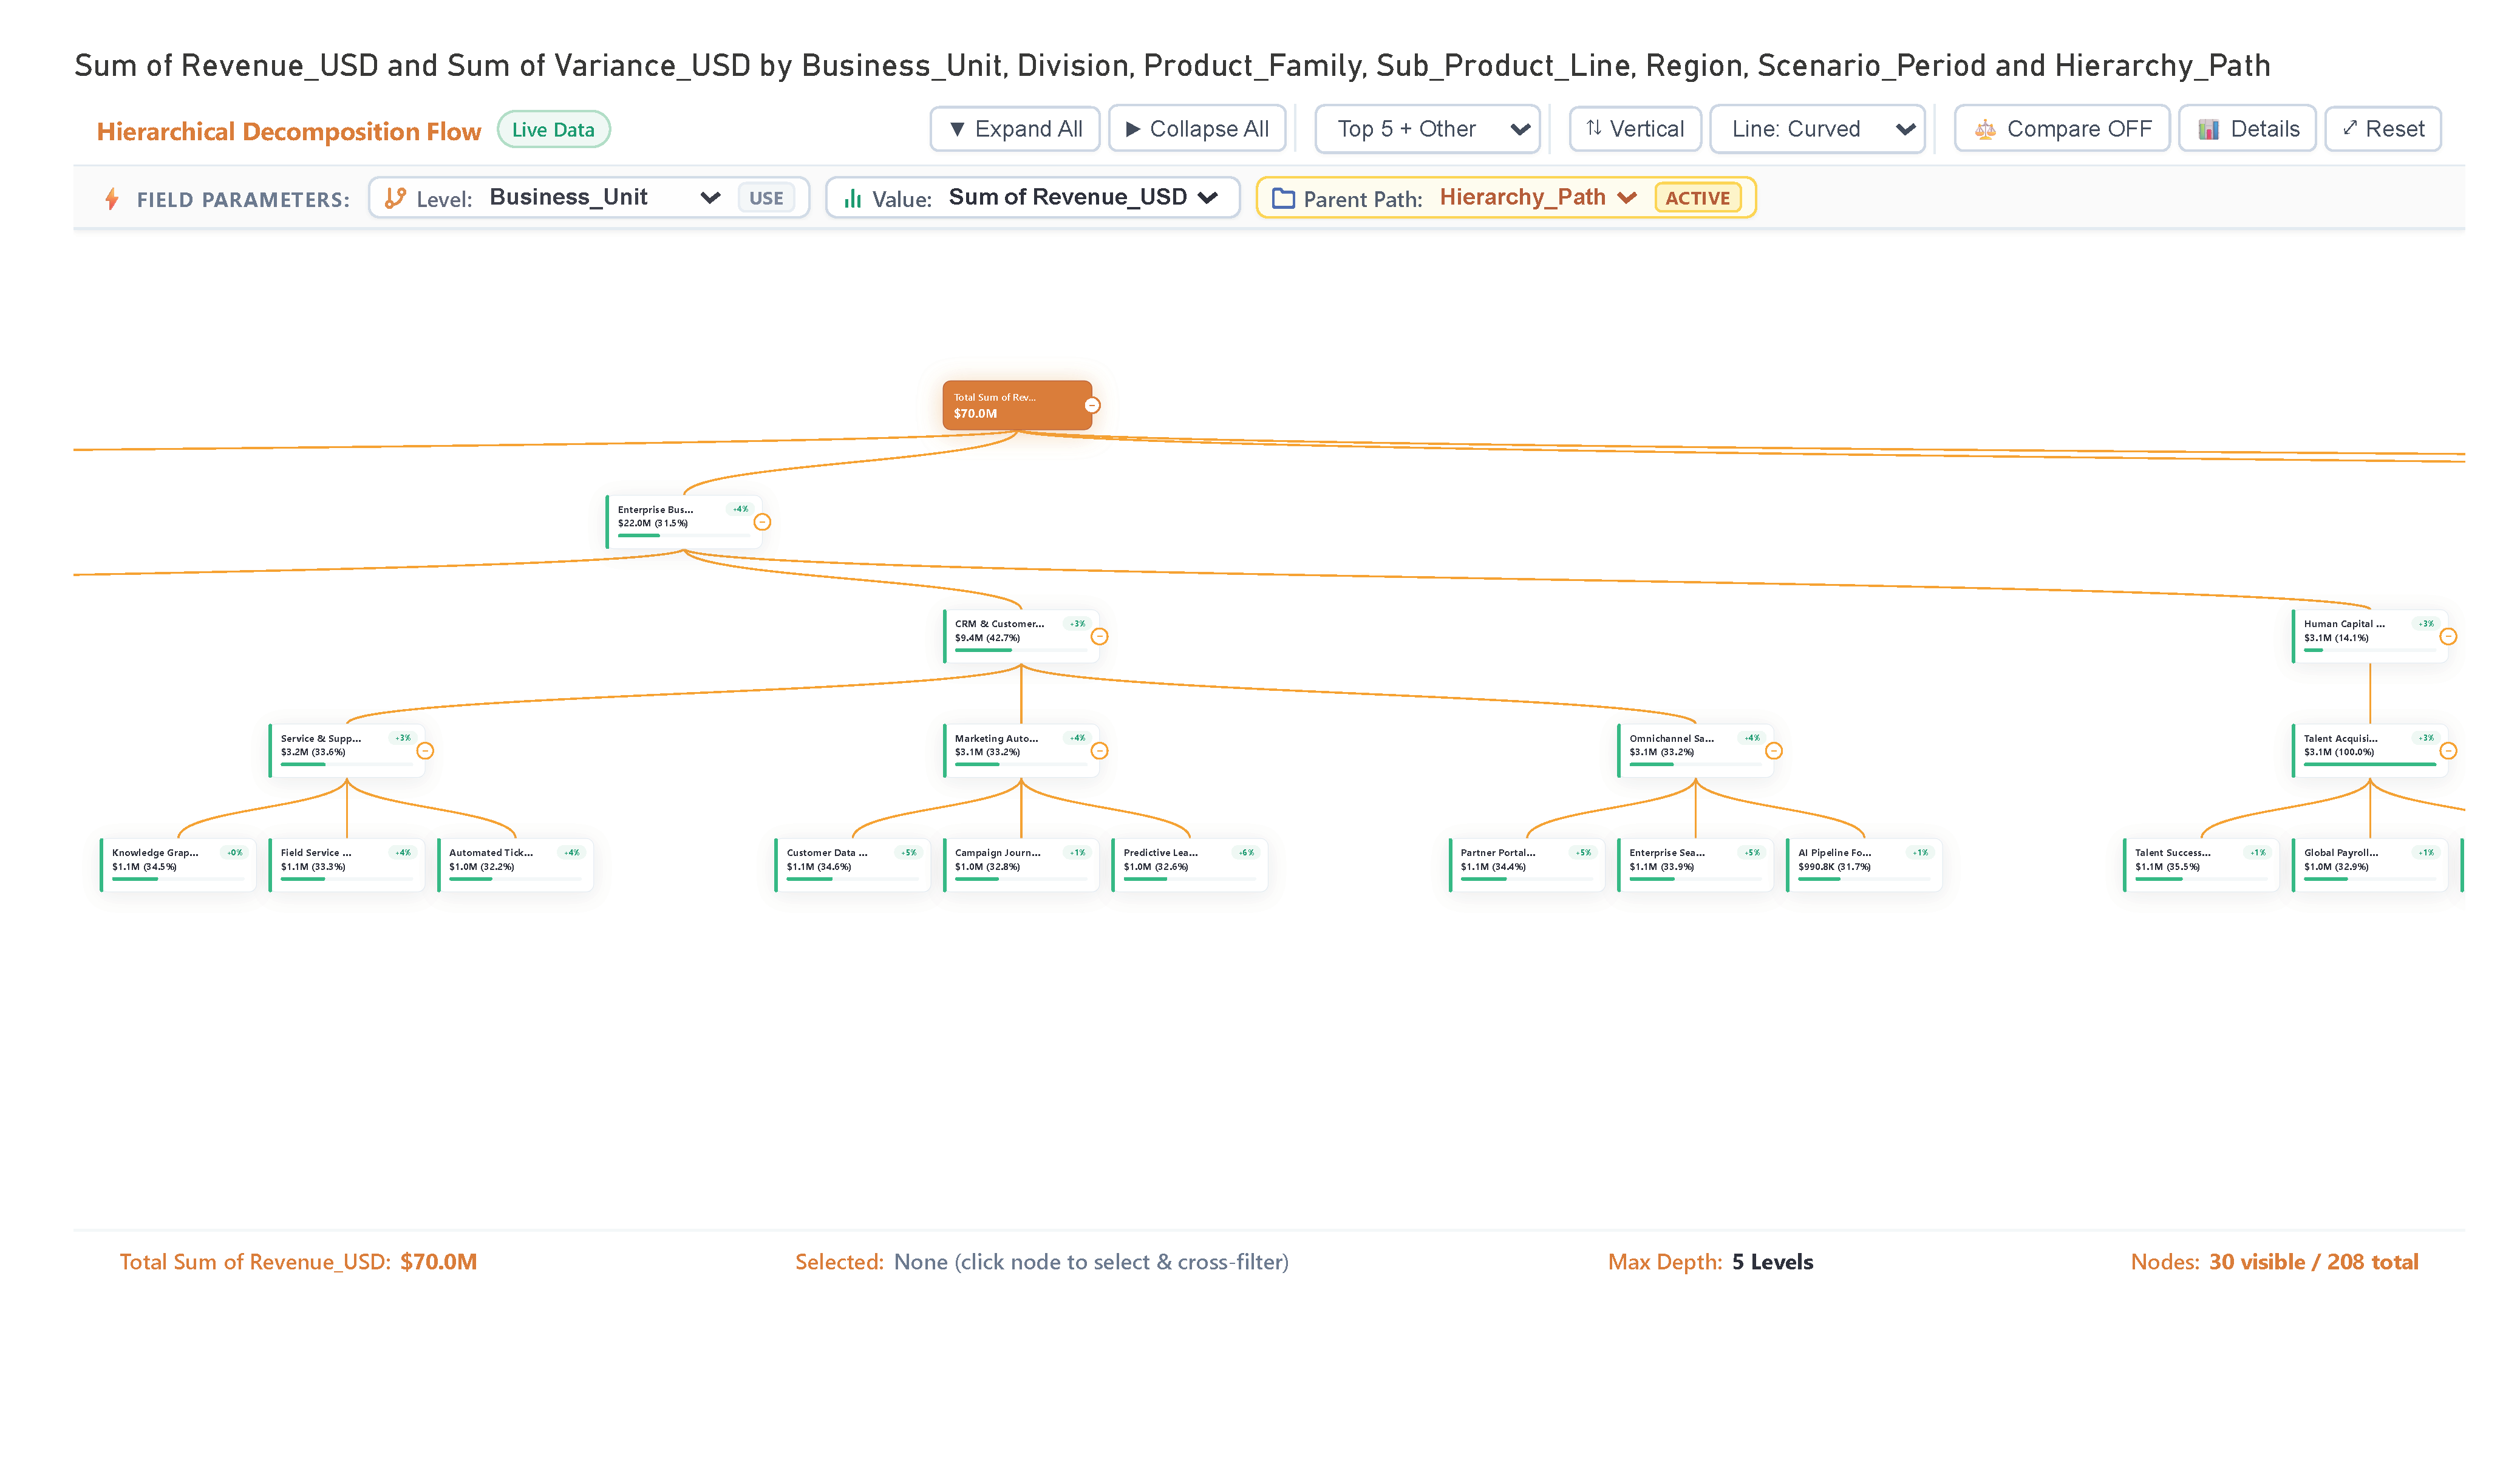
  • Interactive Orientation: Toggle between Horizontal and Vertical layouts.

These features enhance the user's ability to interact with and analyze complex datasets effectively, providing a more comprehensive and flexible tool for root-cause contribution and variance analysis.

Conclusion

In conclusion, the Hierarchical Decomposition Flow with Contribution Waterfall Nodes offers a versatile and powerful tool for financial analysis and root-cause decomposition. By combining the strengths of a decomposition tree with the nuanced insights of a waterfall chart, it provides unparalleled clarity into data hierarchies. With dynamic features like Top-N grouping, dual-tree comparison, and interactive orientations, it empowers users to efficiently slice and dice their data, maintain focus on critical elements, and enhance the overall analytical experience in Power BI.

Key Features:

  1. Hierarchical Tree Decomposition:

    • Multi-level drilldown from total root to leaf SKU/product levels, giving users a clear path of how components build up to the total.
  2. Contribution Waterfall Nodes:

    • Nodes display absolute contribution value, % of parent, % of total, and an embedded mini progress waterfall bar, providing deep context at a glance.
  3. Variance-Based Coloring:

    • Automated positive (teal/green) and negative (rose/red) coloring and variance percentage delta pills highlight over- and under-performance.
  4. Top-N + Residual "Other" Grouping:

    • Focus on the most significant drivers (e.g., Top 3 or Top 5) while automatically grouping the remaining elements into an "Other" category to prevent clutter.
  5. Dual-Tree Compare Mode:

    • Enables side-by-side comparison of two periods or scenarios (e.g., Actual vs Budget), making period-over-period analysis seamless.
  6. Interactive Orientation & Connectors:

    • One-click toggle between Horizontal and Vertical layouts, along with adjustable connector styles (curved bezier, stepped orthogonal elbow, and straight).

Other products

Office Solution Capacity Monitoring tool enables organizations to track Centrally:-

Dynamic Price Elasticity Heat Map

Dynamic Price Elasticity Heat Map

Calendar Chart

Calendar Chart

Magic Grid PBI Enterprise Solution

Power BI Magic grid which allows Write back into the database, ML Capa

Multi-Entity Timeline Network

Barley Trellis chart

The Barley Trellis chart, inspired by Becker et al.'s groundbreaki

Magic Grid Advanced Analytics ChatGPT Solution

Magic Grid Advanced Analytics ChatGPT Solution

Client Coverage Network Timeline

Bar Chart with Dynamic Range creation

Empower users with dynamic bar charts, allowing real-time numeric aggr