Tool Is Certified by Microsoft:


For more information visit our Microsoft app source link https://appsource.microsoft.com/en-ie/product/power-bi-visuals/officesolution1640276900203.line-bubble-chart-by-office-solution?tab=Overview
Office Solution Capacity Monitoring tool enables organizations to track Centrally:-
The Circular Dendrogram Chart offers a unique and vis
Power BI Premium Capacity Analytics Solution Reduce your Power BI prem
Empower your data analysis with our Bar Chart featuring export capabil
Sales Velocity Chart
Calendar Chart
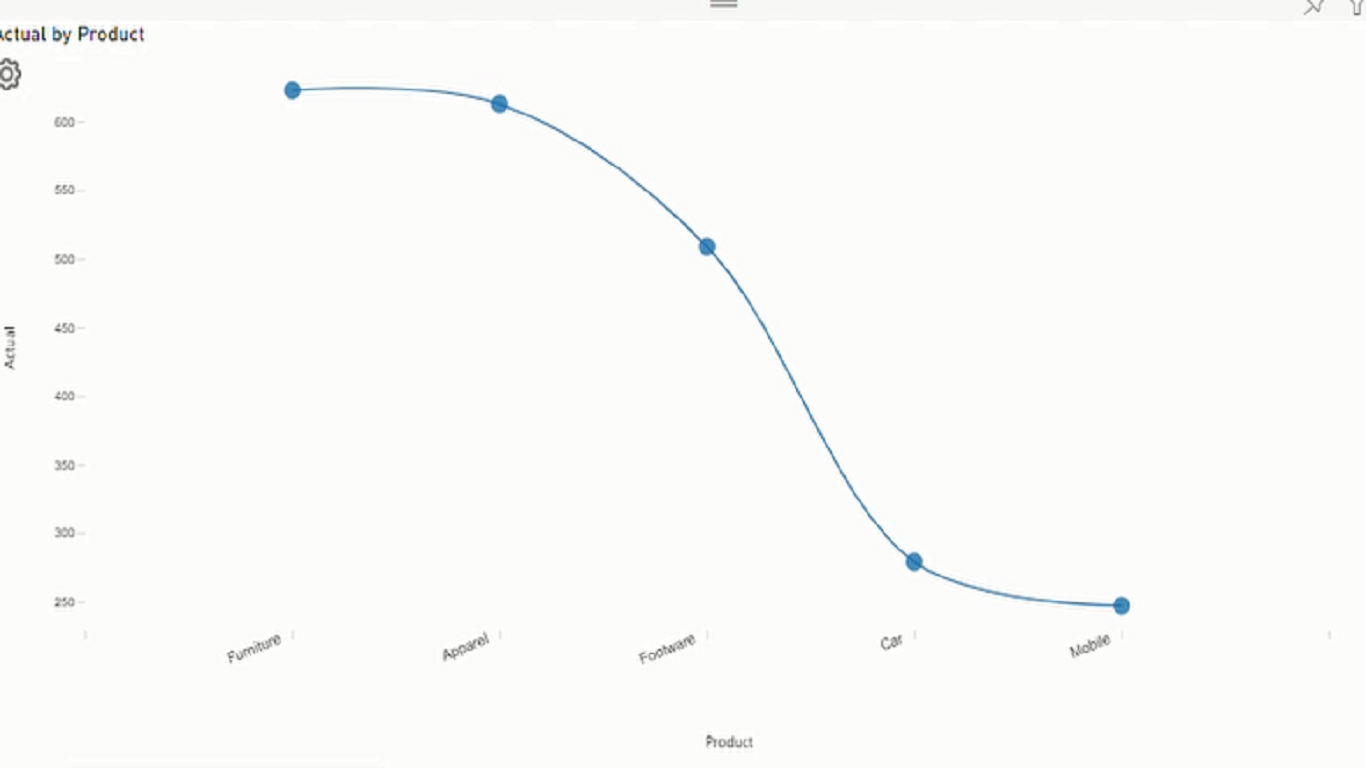
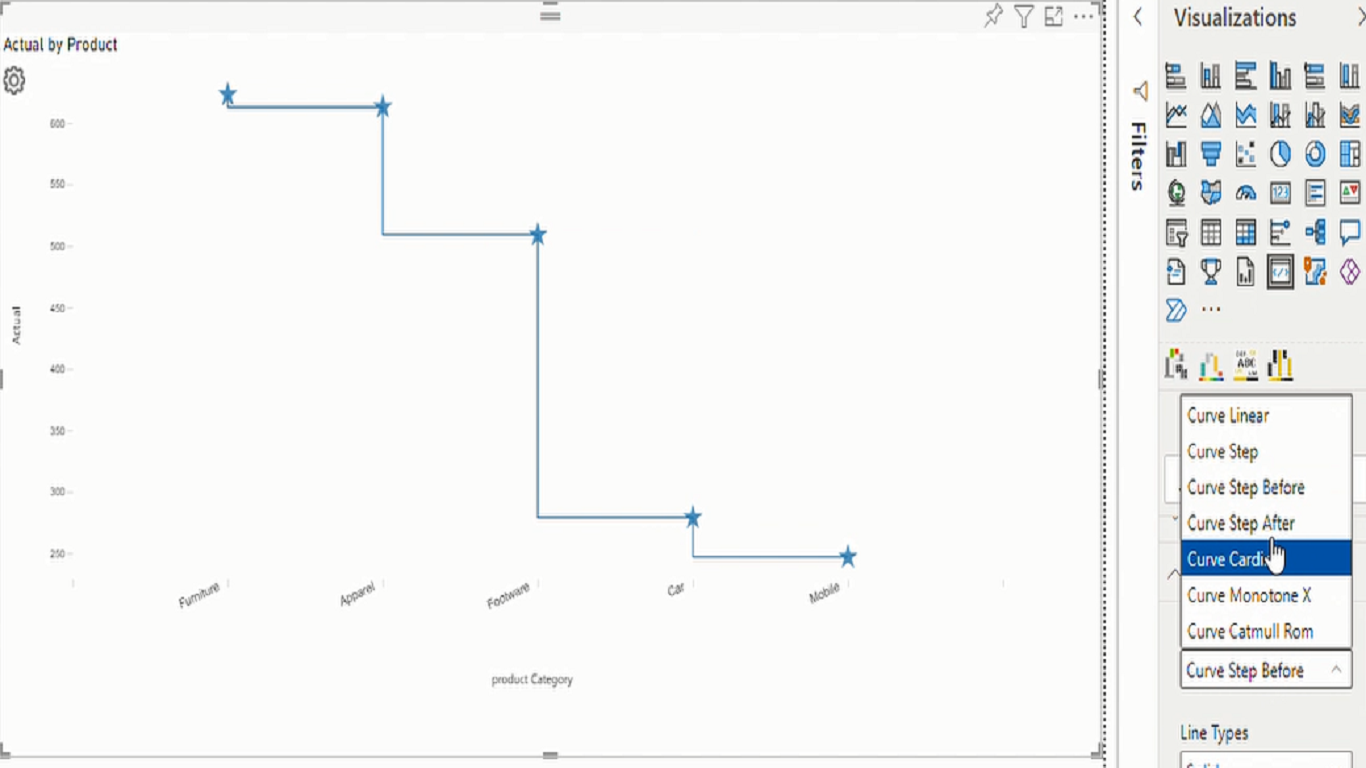
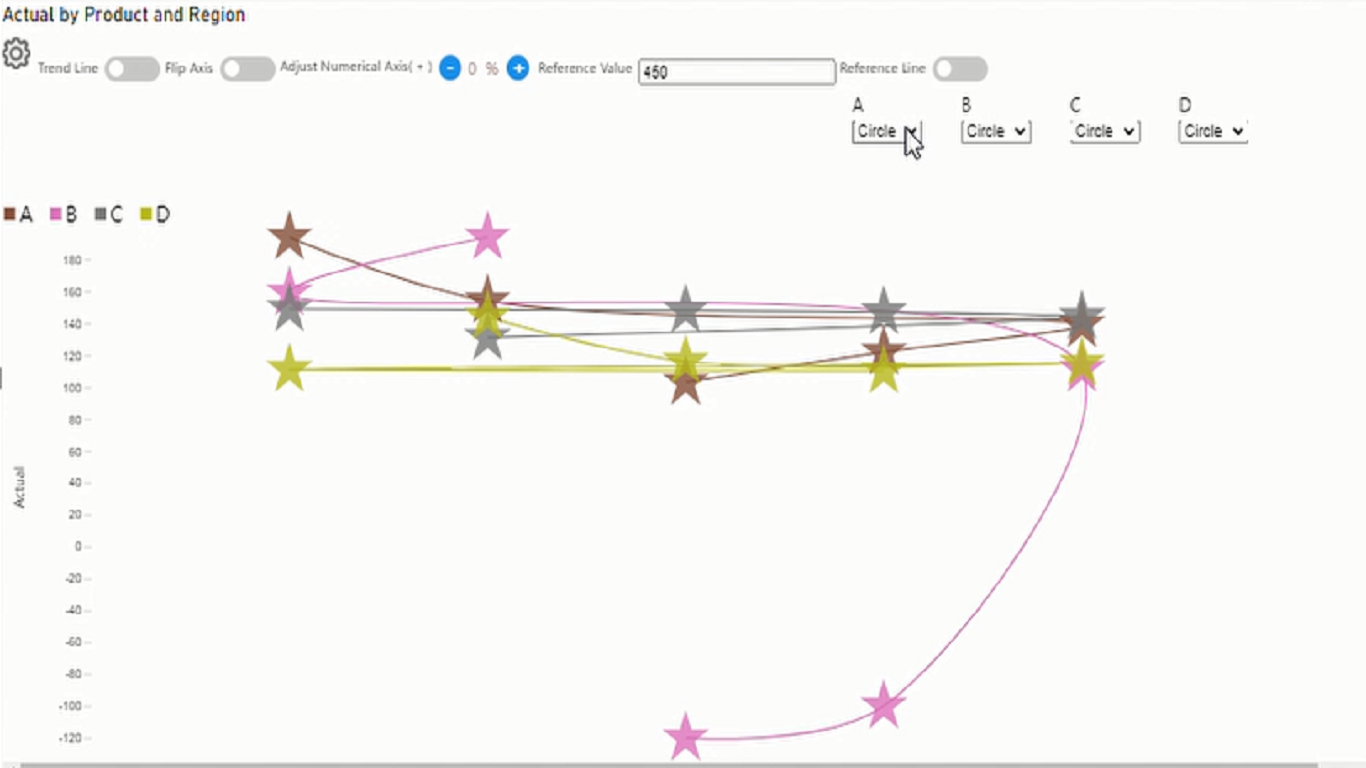
Experience the versatility of Line and Scatter Plot Chart, where you c
A Voronoi diagram is a way of dividing a plane into regions based on d
The Spiral Plot by Office Solution offers a unique way to visualize da