Tool Is Certified by Microsoft:

For more information visit our Microsoft app source link https://appsource.microsoft.com/en-us/product/web-apps/officesolution1640276900203.magic-grid-pbi-report-bust-solution?tab=Overview
Office Solution Capacity Monitoring tool enables organizations to track Centrally:-
Select Top N number of items to be displayed in chart and rest items w
The chart you are working with is designed to provide users with power
A quantile dot plot is a powerful visualization tool that represents t
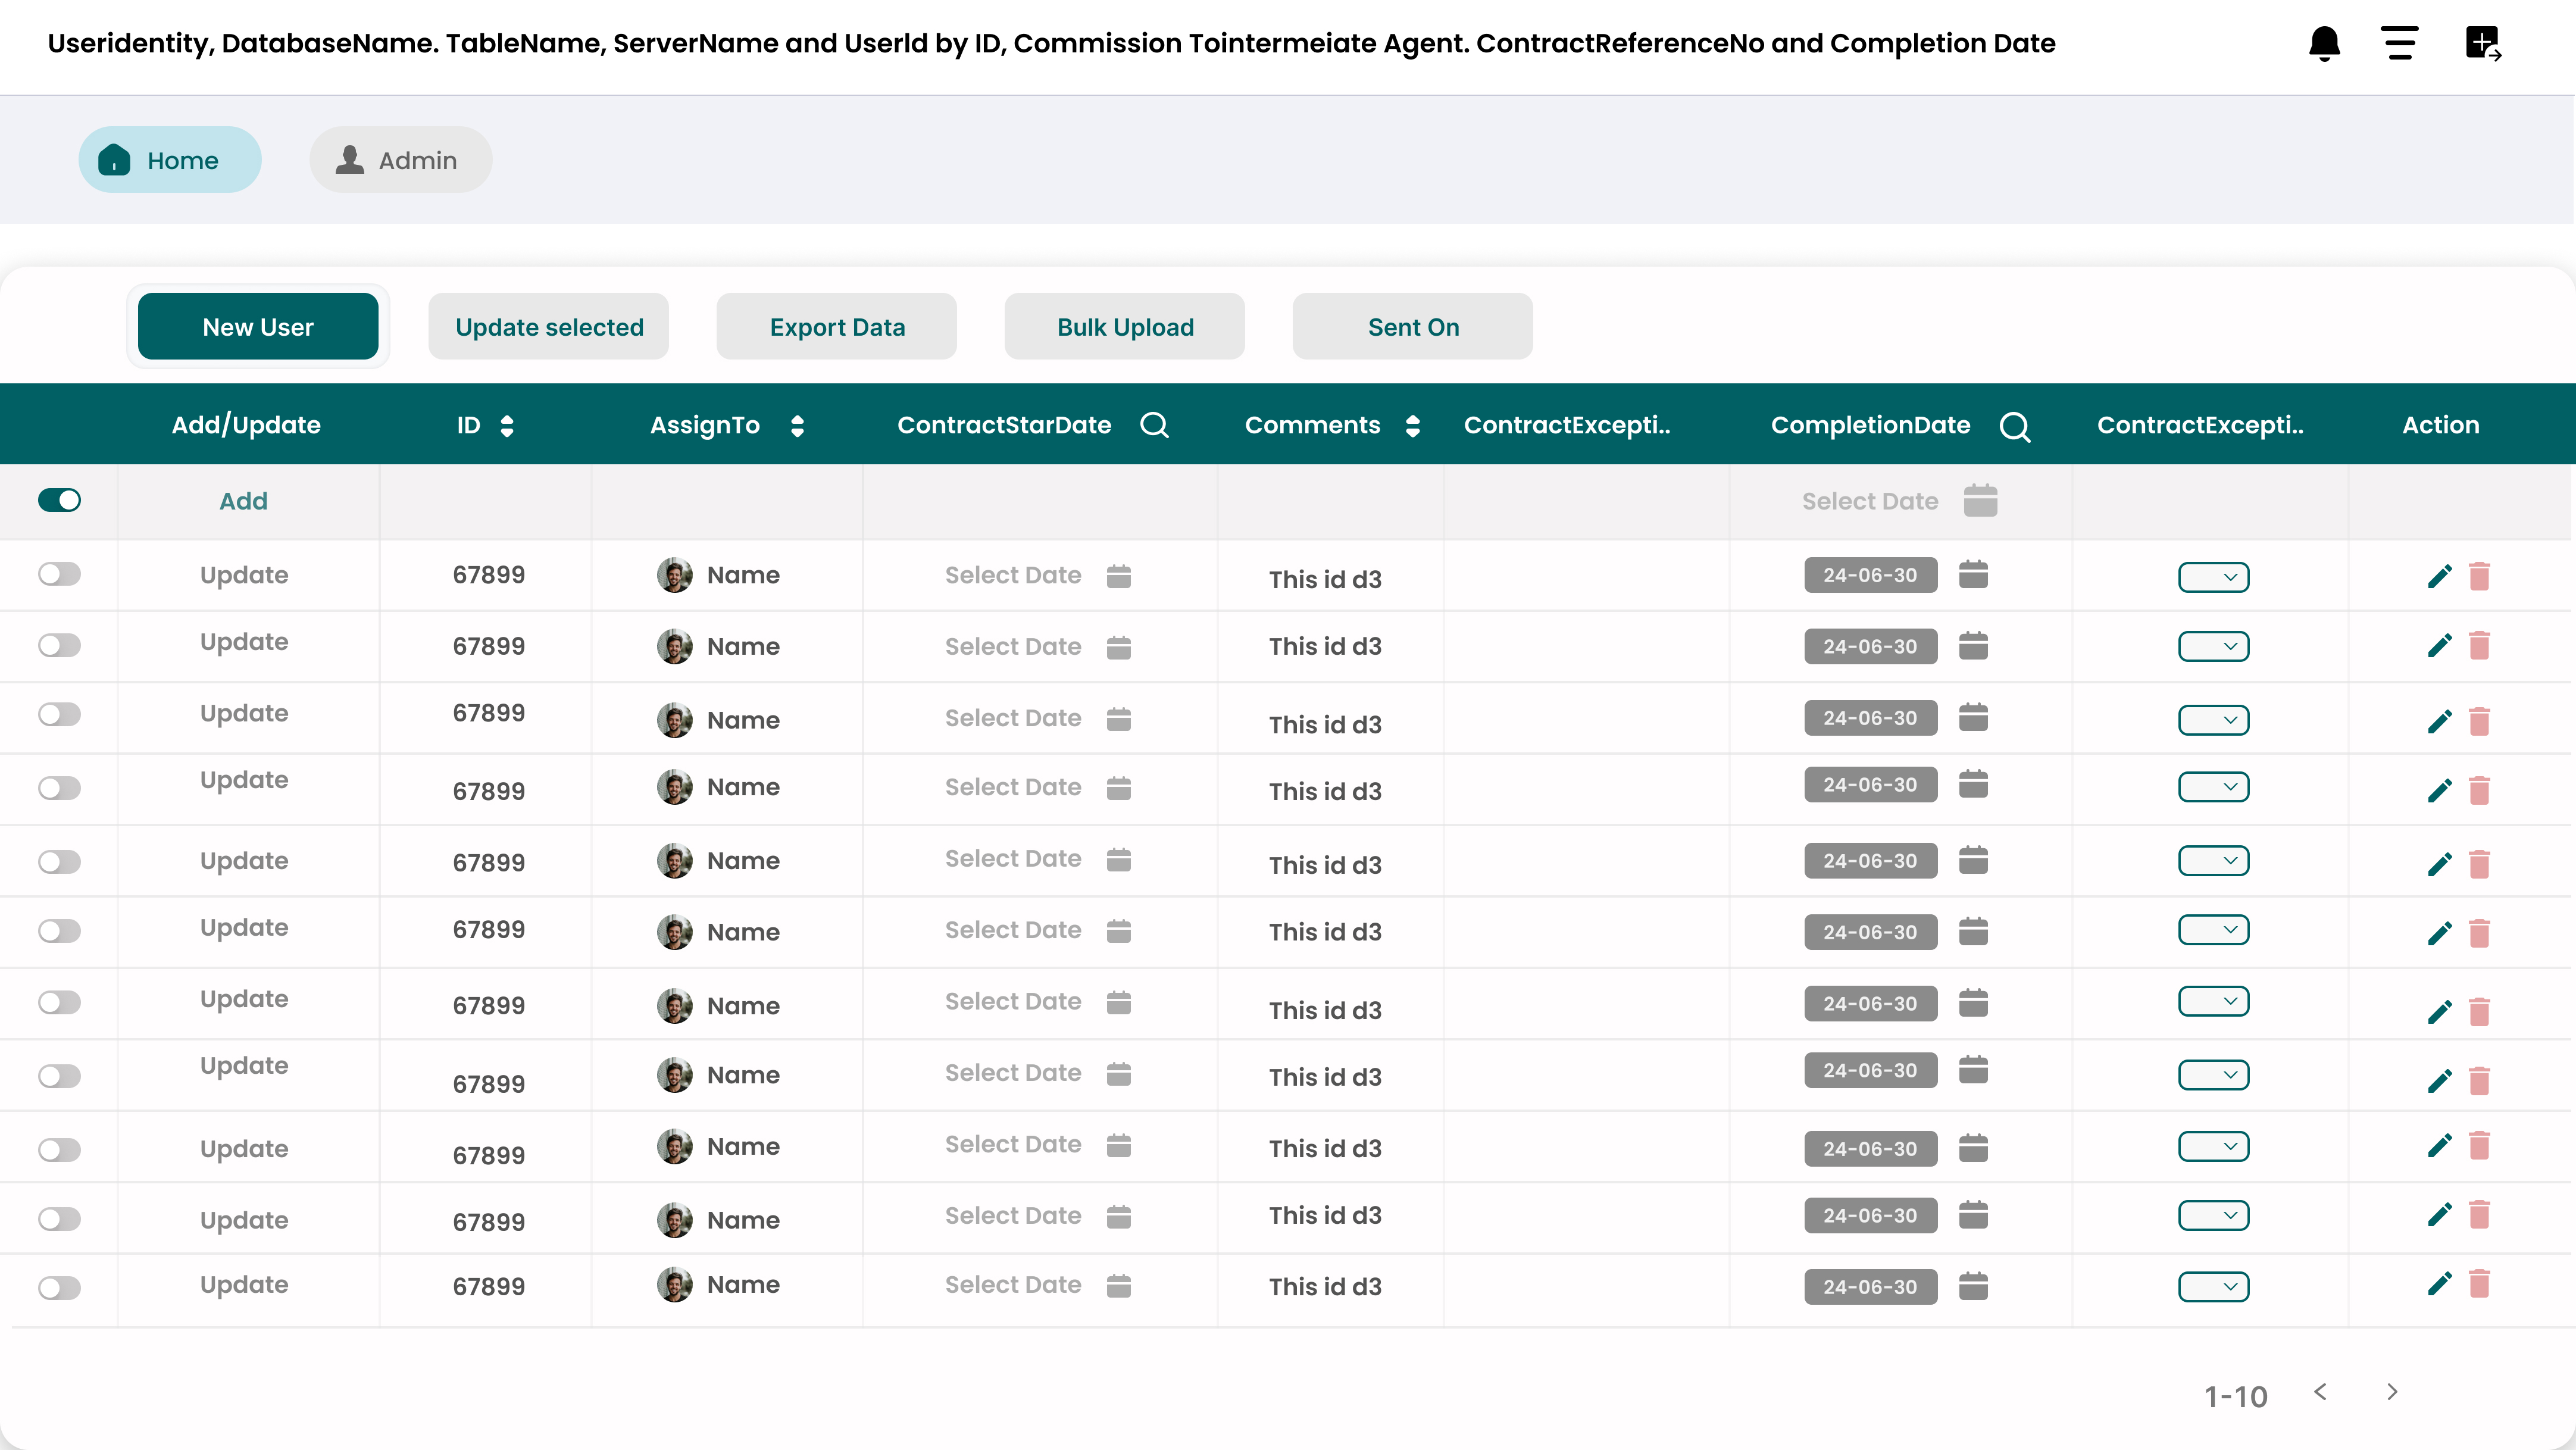
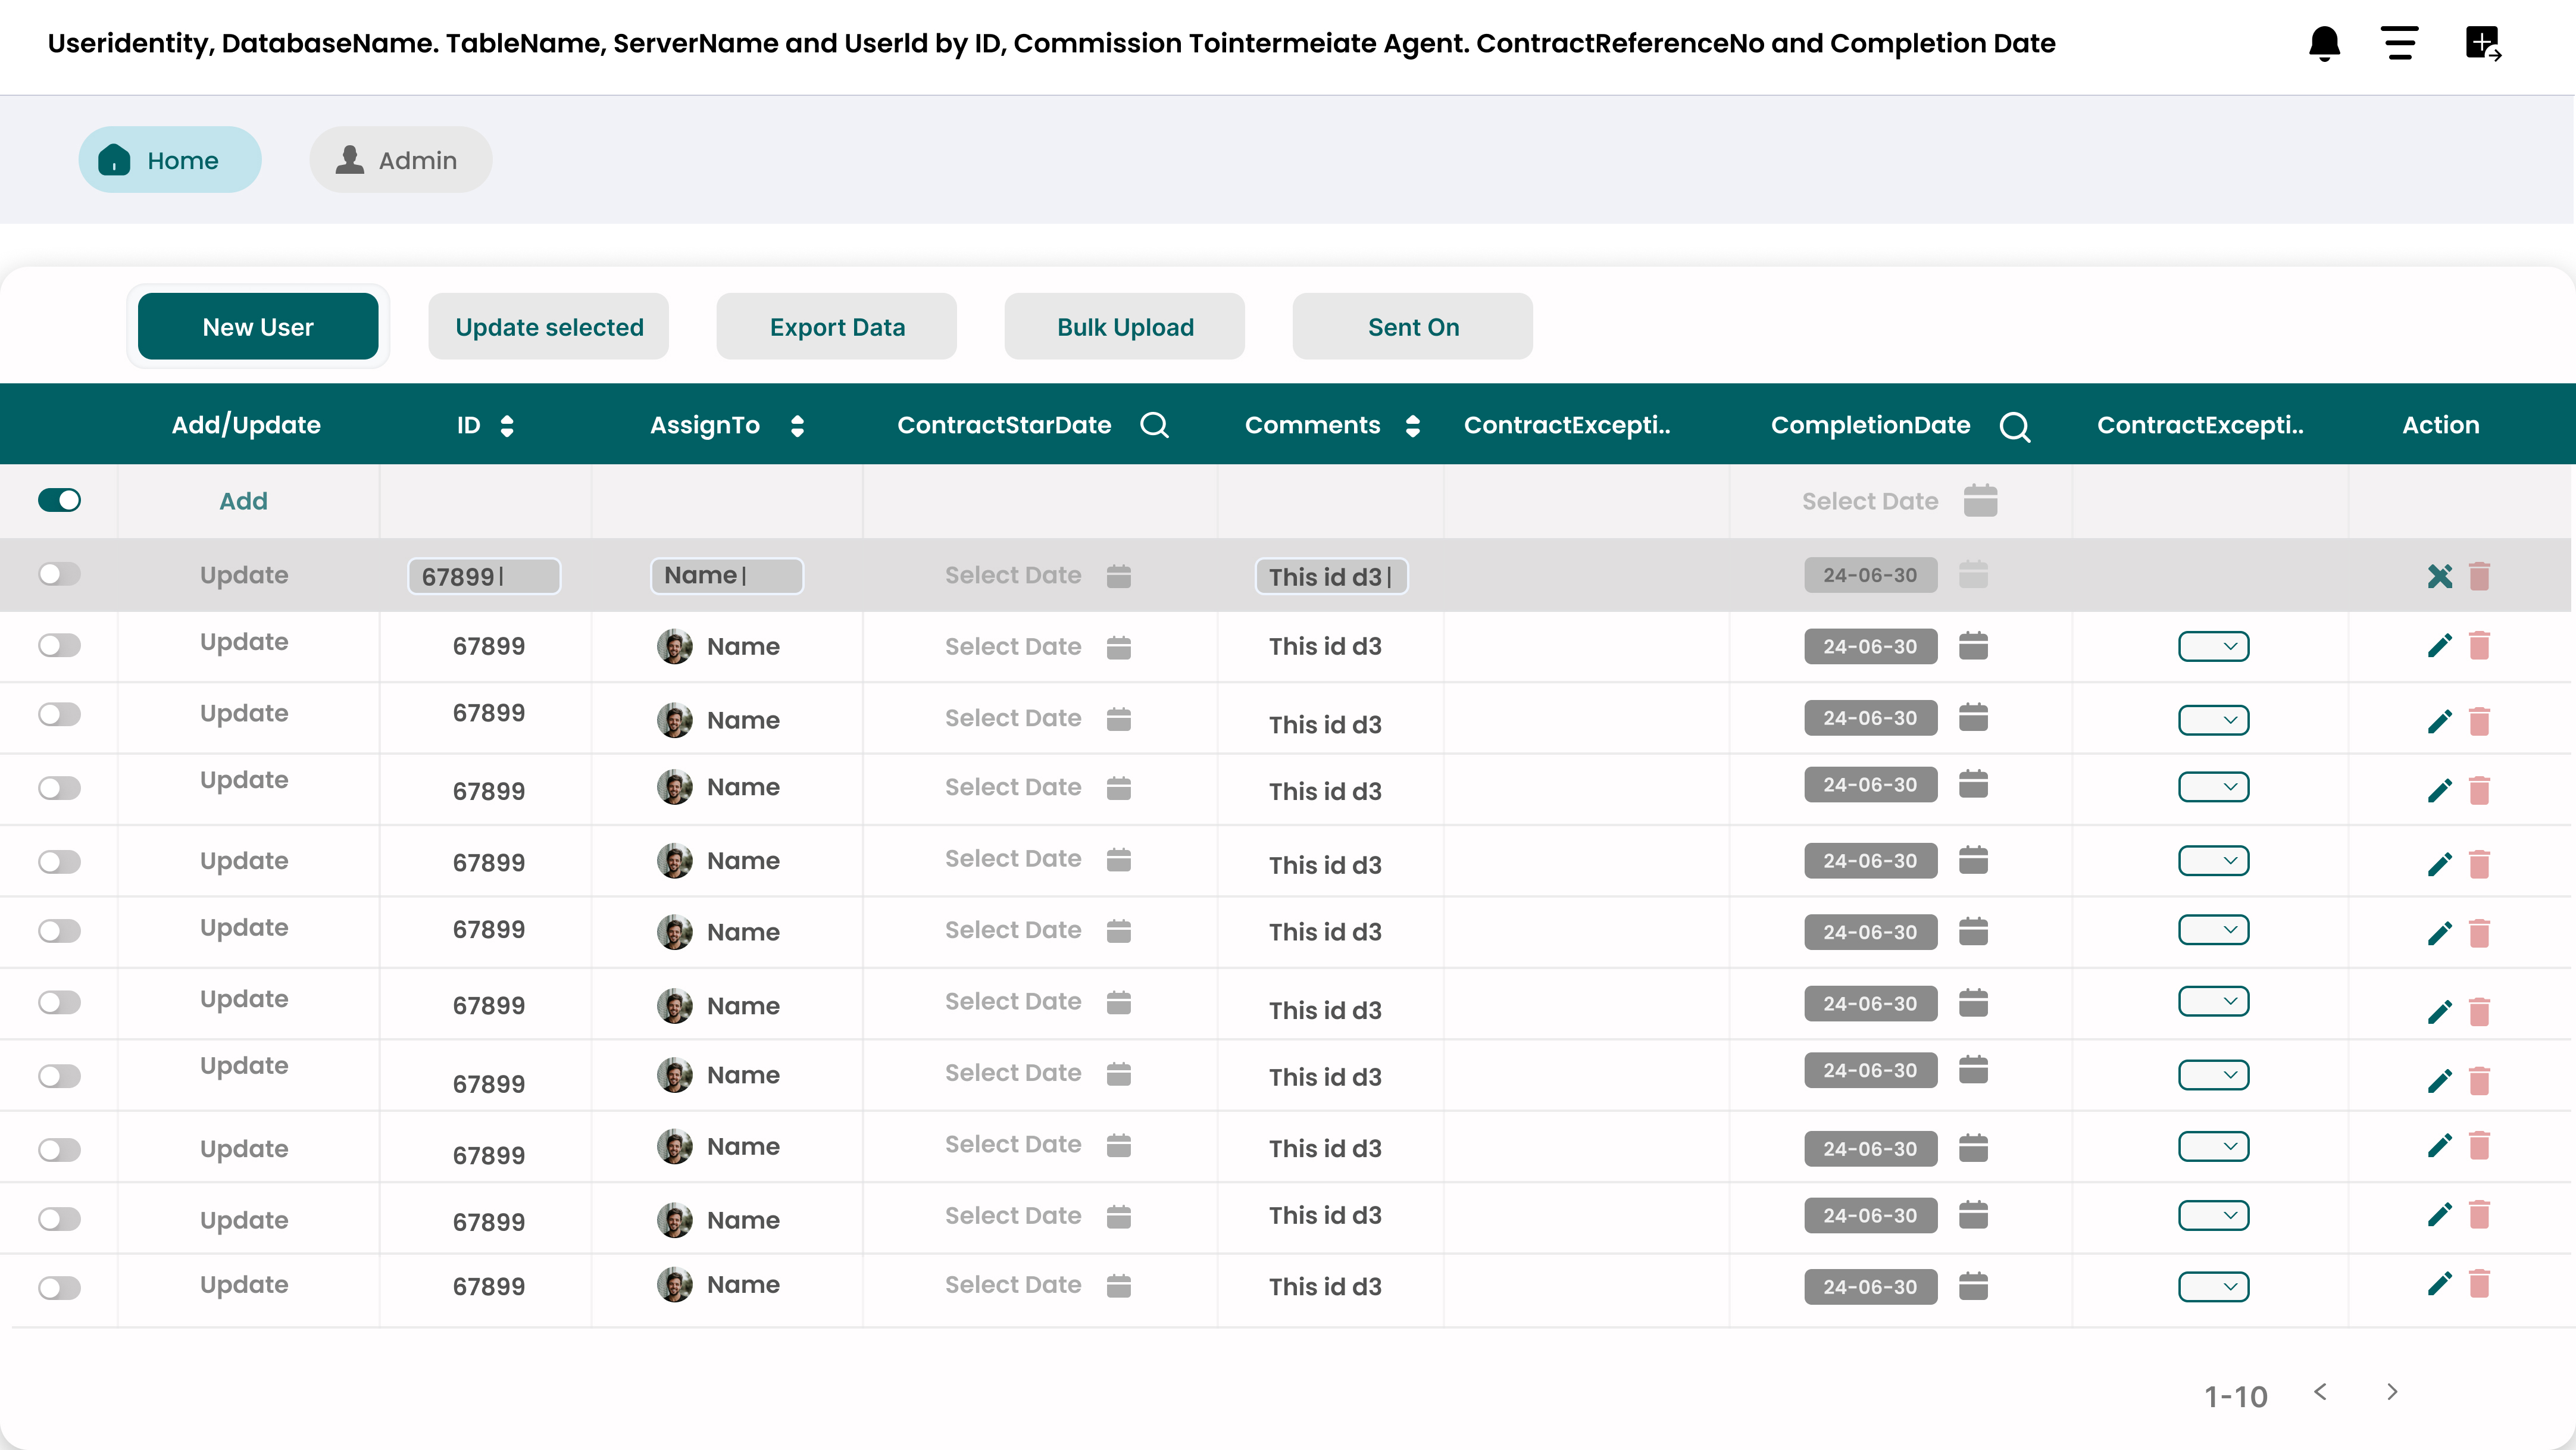
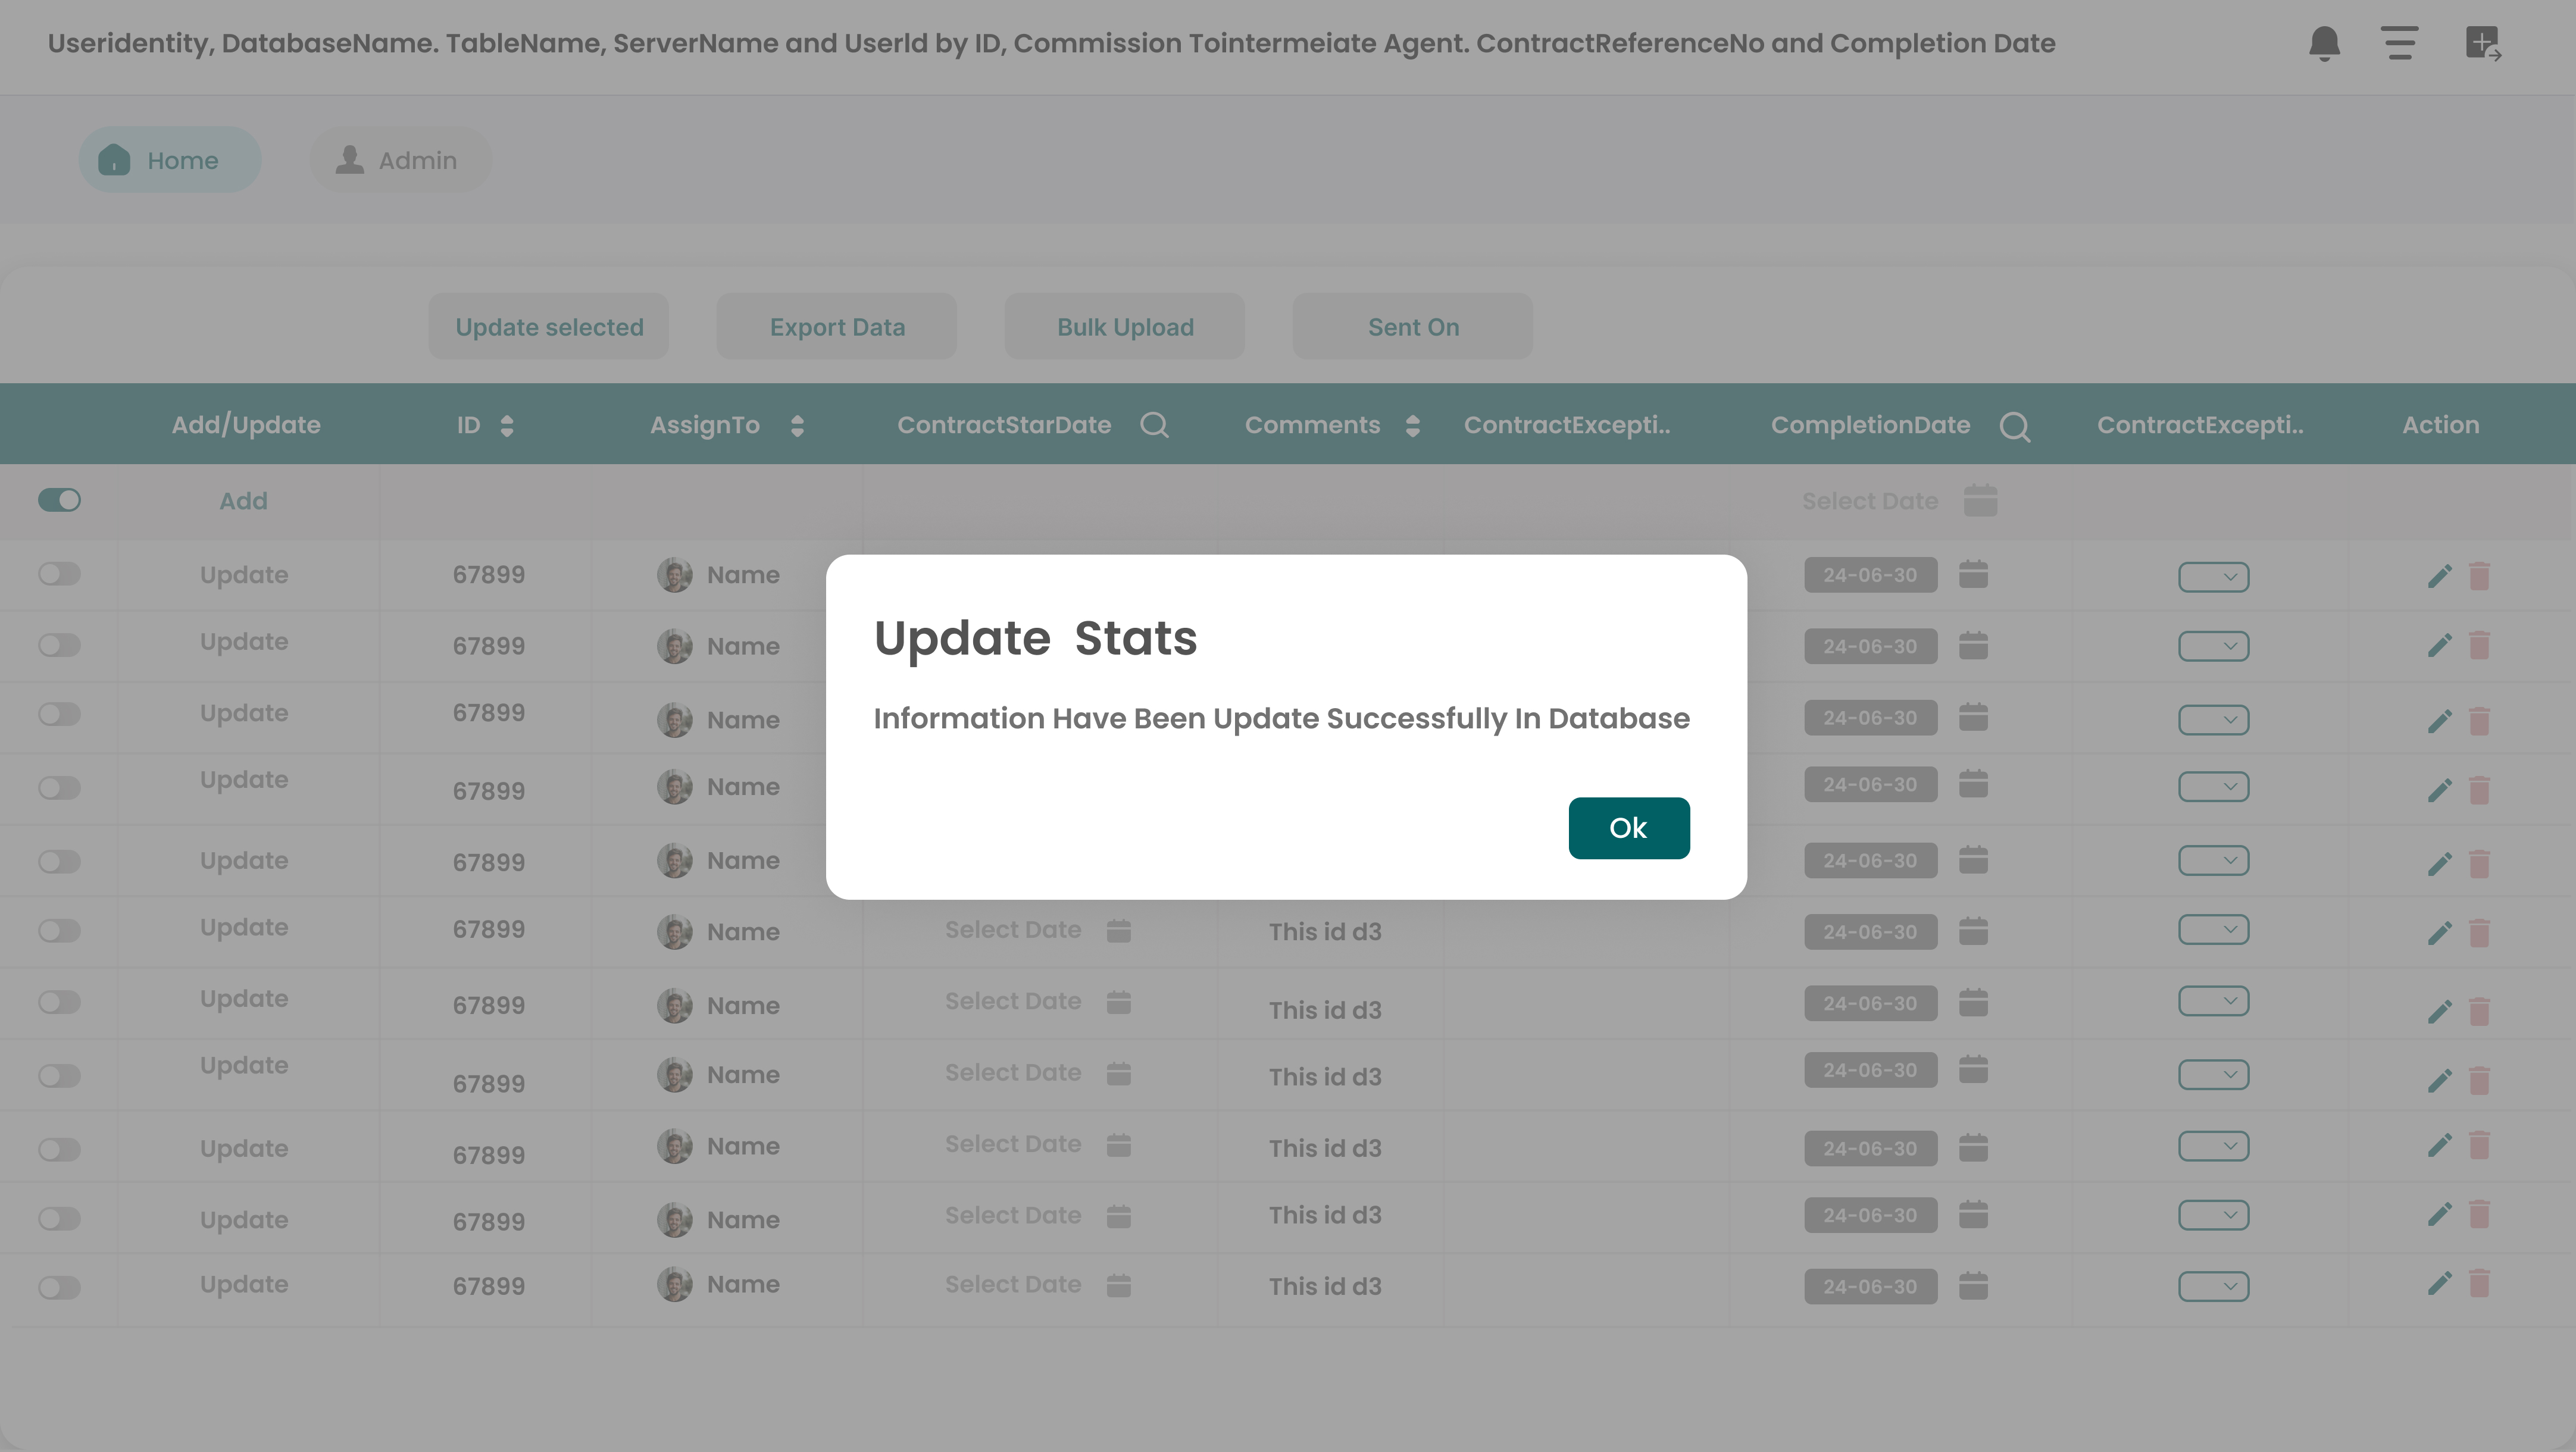
Power BI Magic grid which allows Write back into the database, ML Capa
The Hanging Rootogram chart is an advanced statistical visualization t
Empower users with dynamic bar charts, allowing real-time numeric aggr
The Spiral Plot by Office Solution offers a unique way to visualize da