Product Detail

Multi-Book Risk Surface

Tool Is Certified by Microsoft:

Problem Statement

In investment banking and capital markets trading, market risk managers and desk heads struggle to synthesize multi-dimensional risk profiles across fragmented systems. Common challenges include:

  1. Fragmented Risk Metrics: VaR, Expected Shortfall, and Greek sensitivities are scattered across isolated report pages, forcing managers to mentally correlate multiple tables.

  2. Cumbersome Stress Testing: Comparing baseline exposure against macroeconomic stress shocks requires manual reconciliation across multiple scenario views.

  3. Lack of Greeks Interactivity: Standard reports show Greek tables as static grids, making it difficult to understand directional hedge imbalances and curve risks at a glance.

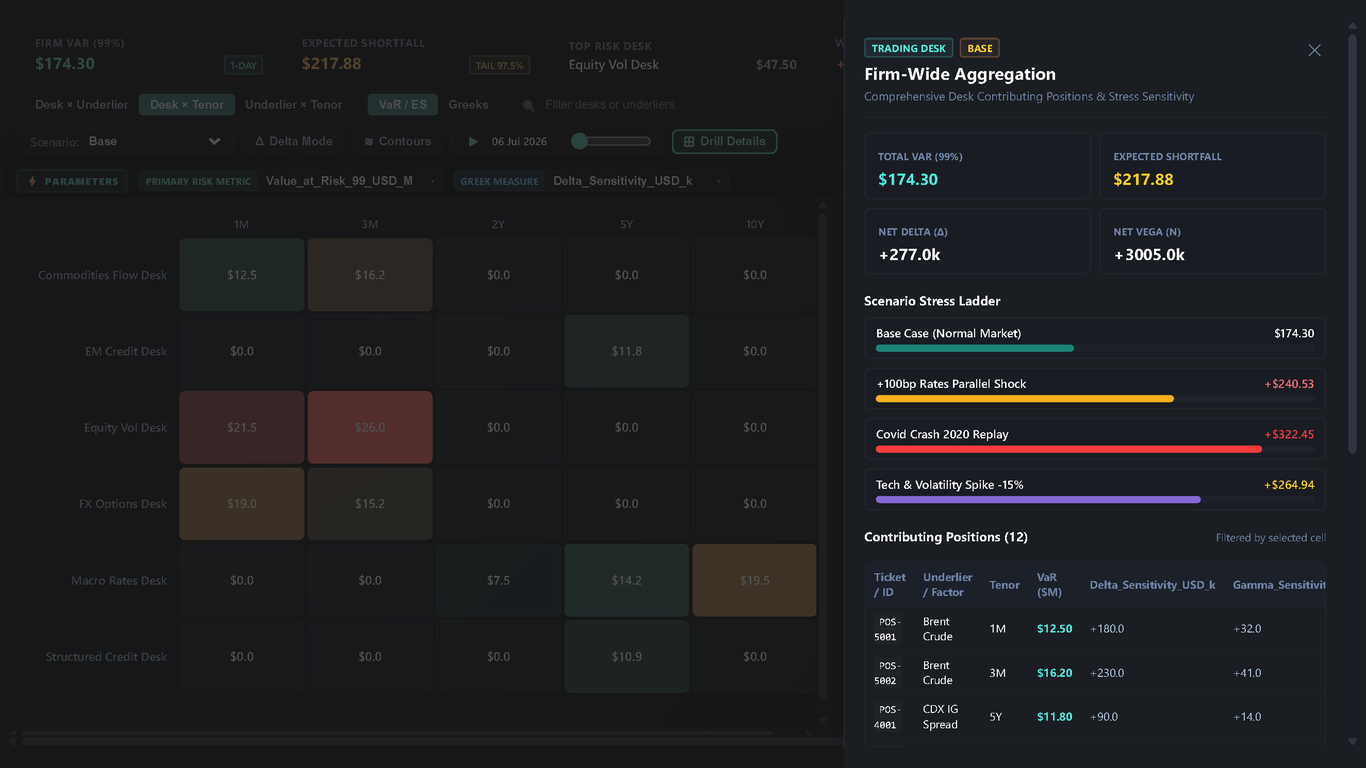
  4. Disconnected Drilldown Context: Clicking high-risk exposure blocks rarely provides immediate access to the underlying position tickets and scenario ladders driving the vulnerability.

The Multi-Book Risk Surface solves these challenges by combining surface density with interactive risk analytics:

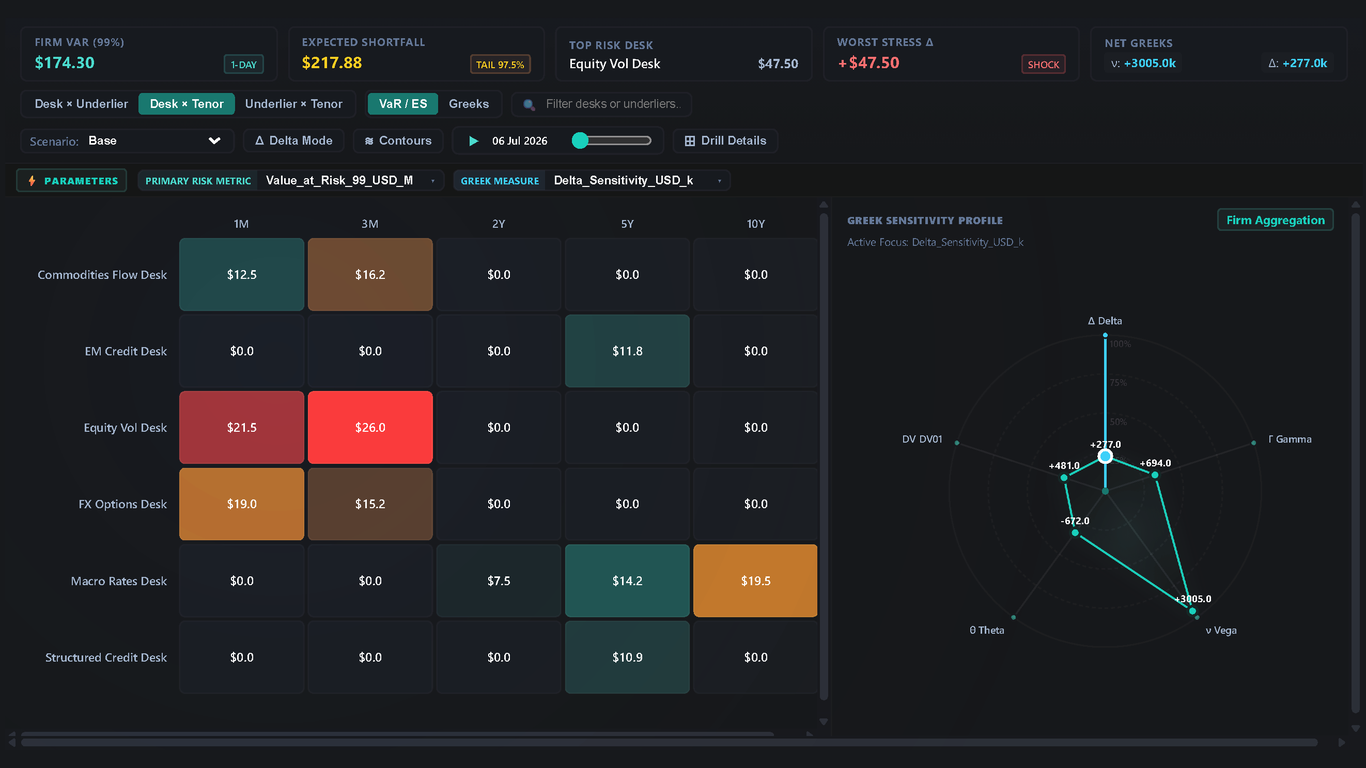
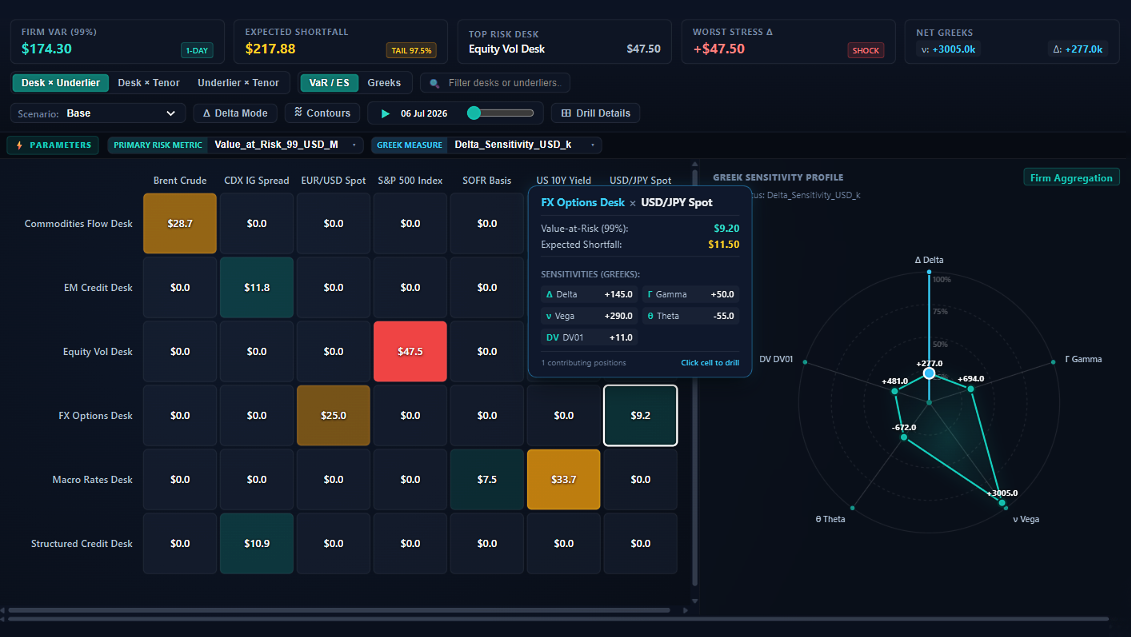
  • Multi-Dimensional Heatmap Surface: Consolidates trading books across underliers and maturity tenors with sequential or diverging risk scales.
  • Linked Greek Polar Radar: Dynamically plots the multi-axis Greek footprint (Delta, Gamma, Vega, Theta, DV01) for selected trading desks with anchor pips and grid rings.
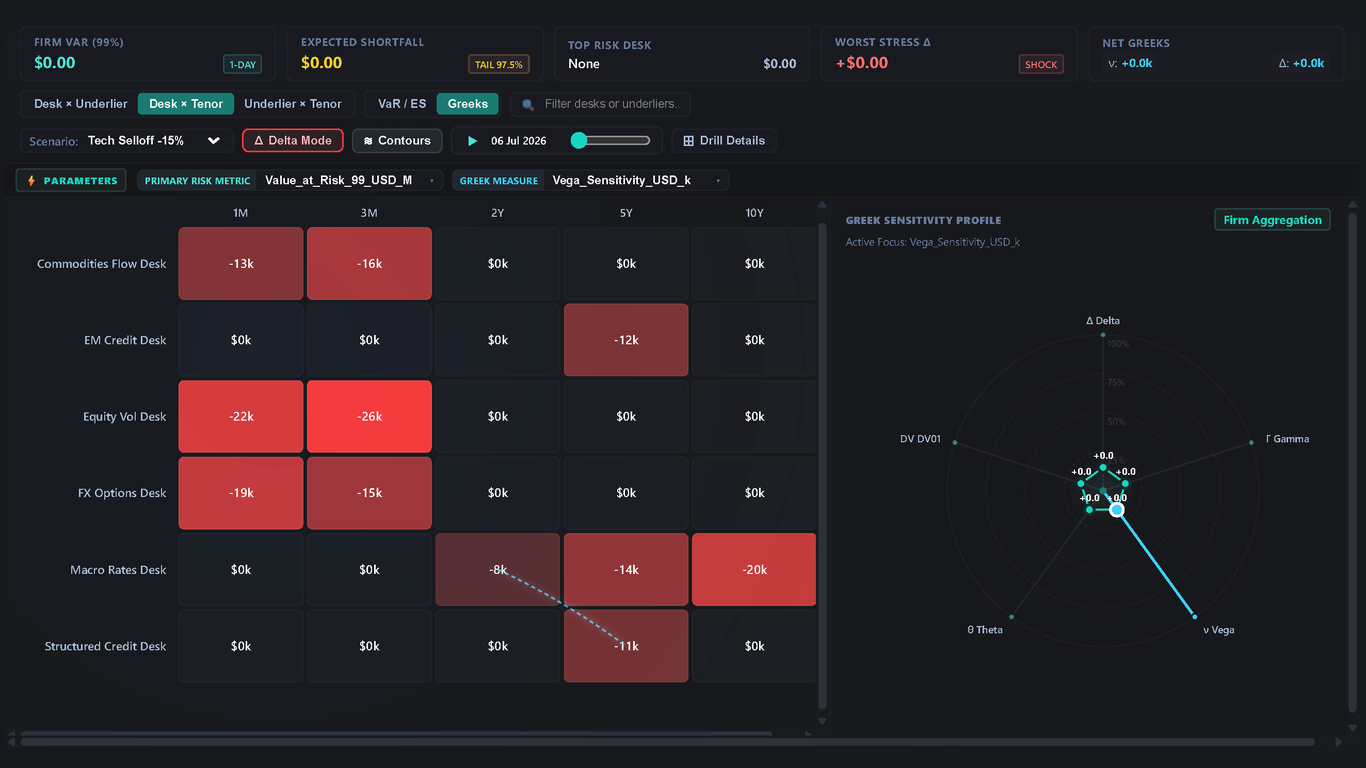
  • Scenario Delta Stress Mode: One-click delta calculation (Stress minus Base) isolating severe capital shocks across books.
  • Dynamic Field Parameter Ribbon: Live switching of primary risk measures and dimensions directly within the visual header.
  • Contextual Drill Drawer & Timeline Scrubber: Deep-dive inspector revealing contributing deal tickets and historical date playback controls.

These features empower risk officers and trading desk leads to pinpoint risk hotspots, evaluate stress impacts, and maintain firm-wide capital limits.

Conclusion

In conclusion, the Multi-Book Risk Surface brings institutional-grade clarity to market risk management and capital aggregation. By integrating multi-dimensional heatmaps, linked Greek polar radars, scenario stress delta overlays, dynamic field switching, and granular position inspection into a single responsive visual, it enables risk teams to safeguard capital, monitor desk limits, and navigate volatile market conditions directly within Power BI.

Key Features:

  1. Multi-Book Risk Heatmap Surface:

    • Interactive matrix displaying trading desks against underliers or maturity tenors with sequential (VaR/ES) or diverging (Greeks) color scales.
  2. Linked Greek Polar Radar Chart:

    • Displays Delta, Gamma, Vega, Theta, Rho, and DV01 sensitivity profiles for selected desks with concentric grid rings and discrete anchor pips.
  3. Scenario Delta Mode (Stress vs Base):

    • Instant calculation of stress deltas (Stress minus Base) highlighting desks and asset classes subject to acute capital erosion under market shocks.
  4. Multi-Perspective Layout Switcher:

    • One-click toggling between Desk x Underlier, Desk x Tenor, and Underlier x Tenor term structures with automated financial tenor sorting.
  5. Dynamic Field Parameter Bar:

    • Horizontal ribbon with scroll chevrons enabling runtime switching of active risk measures and dimensions when multiple fields are mapped.
  6. Risk Contour Isoline Overlays:

    • Curved isolines connecting adjacent risk concentration zones to immediately draw focus to vulnerable portfolio exposures.
  7. Contextual Position Drill Drawer:

    • Slide-out detail panel displaying underlying ticket IDs, position Notionals, asset names, and multi-scenario stress ladders.
  8. Historical Play Axis Scrubber:

    • Timeline playback and interactive slider allowing risk managers to step through historical risk dates and observe exposure drift.
  9. Executive KPI Summary Ribbon:

    • Summary tiles highlighting Firm VaR (99%), Expected Shortfall, Top Risk Contributing Desk, Worst Stress Delta, and Net Greeks.

Other products

Office Solution Capacity Monitoring tool enables organizations to track Centrally:-

Client Coverage Network Timeline

Promo Projection

Hanging Rootogram Chart

The Hanging Rootogram chart is an advanced statistical visualization t

Calendar Chart

Calendar Chart

Magic Grid Advanced Analytics ChatGPT Solution

Magic Grid Advanced Analytics ChatGPT Solution

Adaptive Multi-KPI Radial Performance Matrix

Icon Array Chart

Icon Array Chart by office solution transforms traditional data repres

Lorenz Curve Chart

Lorenz Curve by Office Solution

T