Tool Is Certified by Microsoft:

For more information visit our Microsoft app source link https://appsource.microsoft.com/en-us/product/web-apps/officesolution1640276900203.power-bi-premium-capacity-monitoring-solution
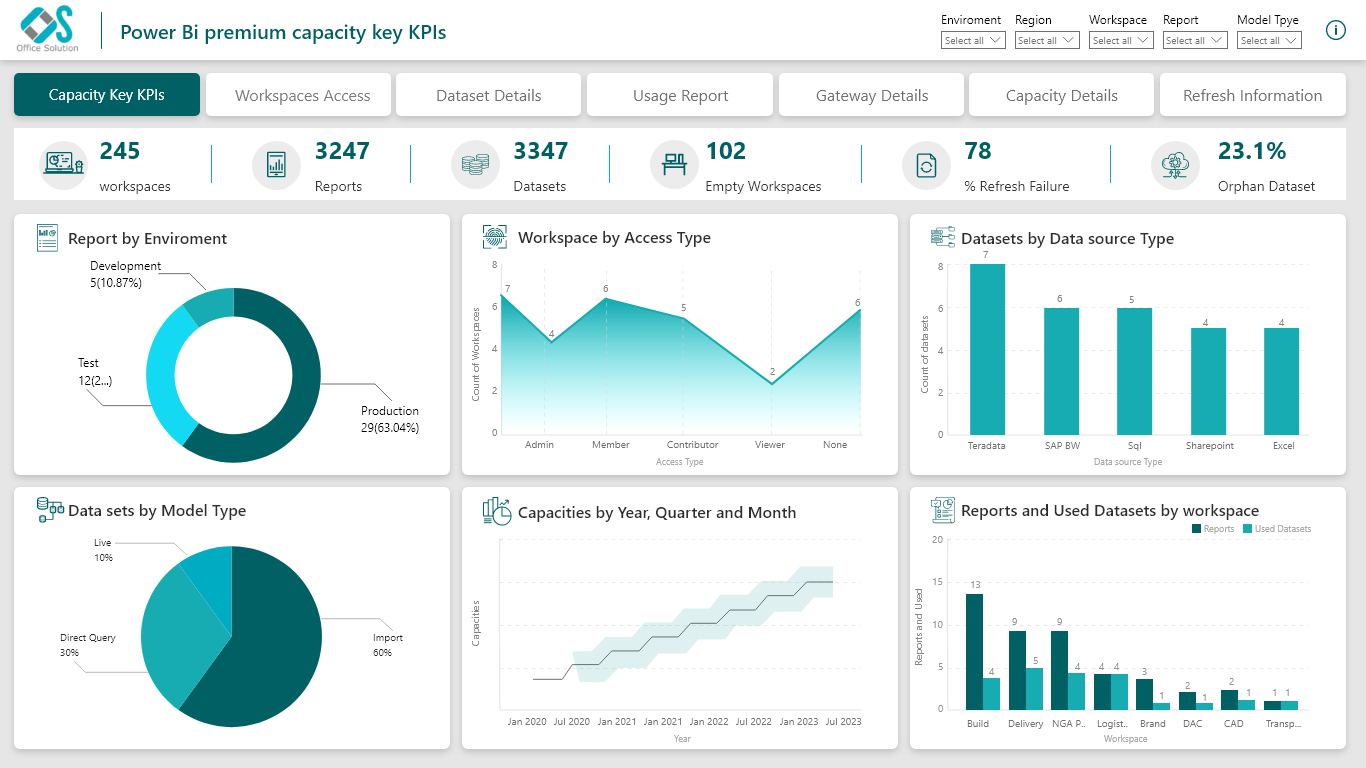
Office Solution Capacity Monitoring tool enables organizations to track Centrally:-
Lorenz Curve by Office Solution
T
The Hanging Rootogram chart is an advanced statistical visualization t
The Spiral Plot by Office Solution offers a unique way to visualize da
Custom Tree View and Bar Chart, offering flexibility in managing column width and height, along w
Supply Chain Network Flow Chart
Magic Grid Advanced Analytics ChatGPT Solution
The Magic Grid PBI Report Burst Solution is a Power B
A Voronoi diagram is a way of dividing a plane into regions based on d