For more information visit our Microsoft app source link https://appsource.microsoft.com/sv-se/product/power-bi-visuals/officesolution1640276900203.sales_velocity_compass_by_office_solution?tab=overview
Office Solution Capacity Monitoring tool enables organizations to track Centrally:-
The Barley Trellis chart, inspired by Becker et al.'s groundbreaki
Dynamic Price Elasticity Heat Map
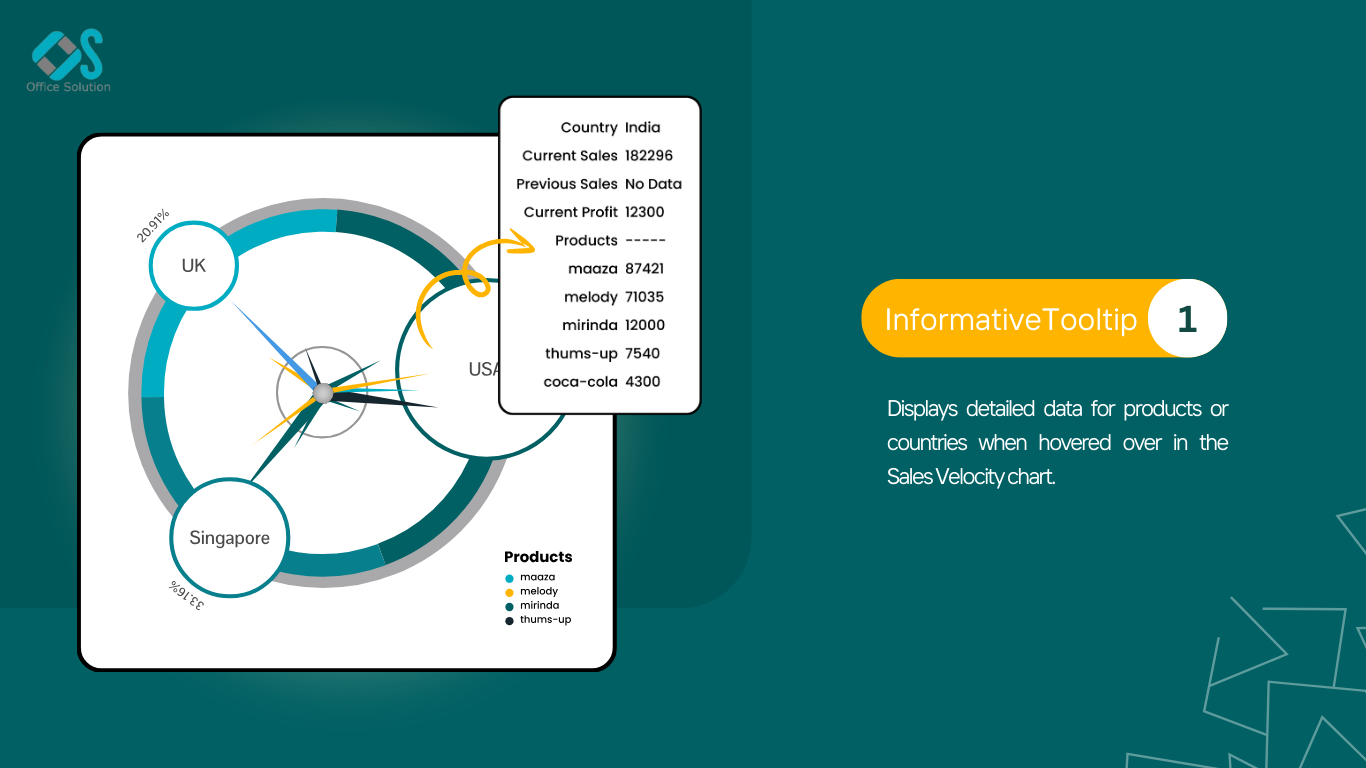
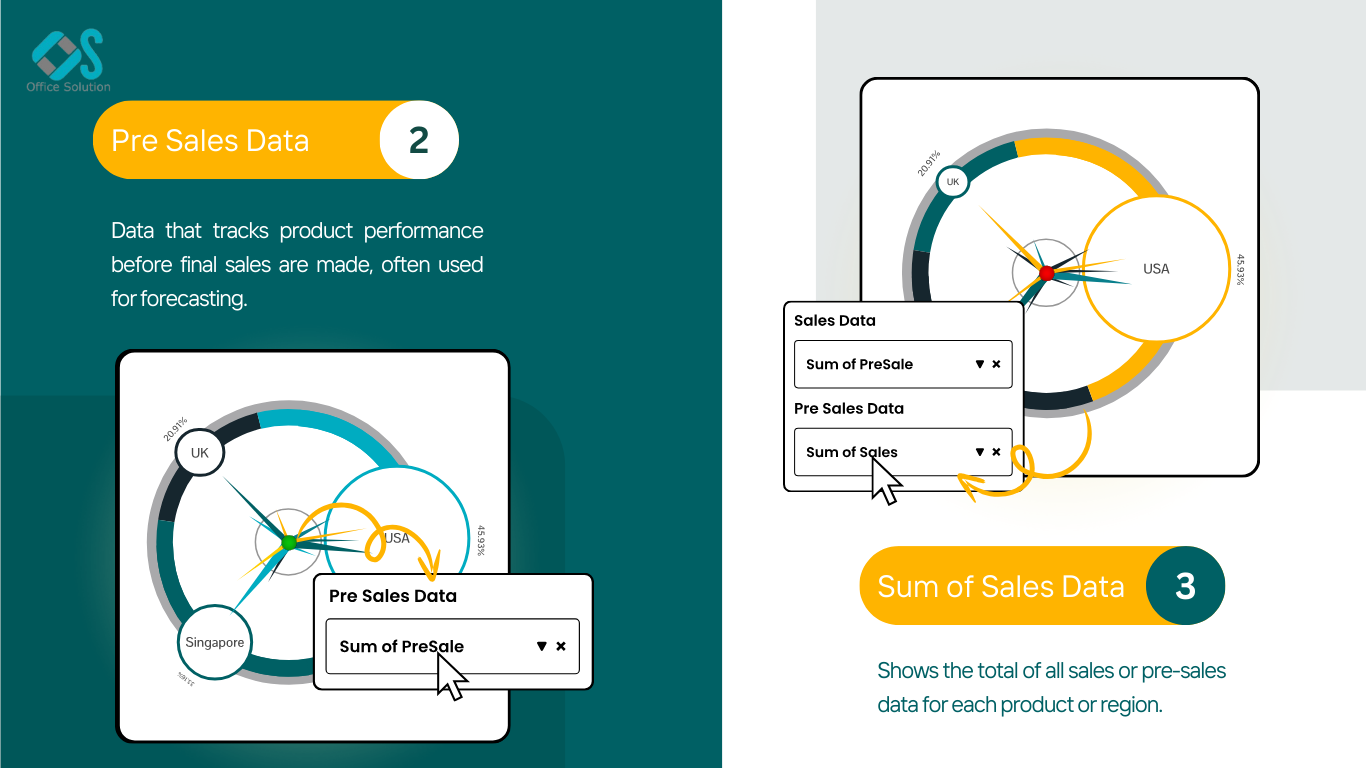
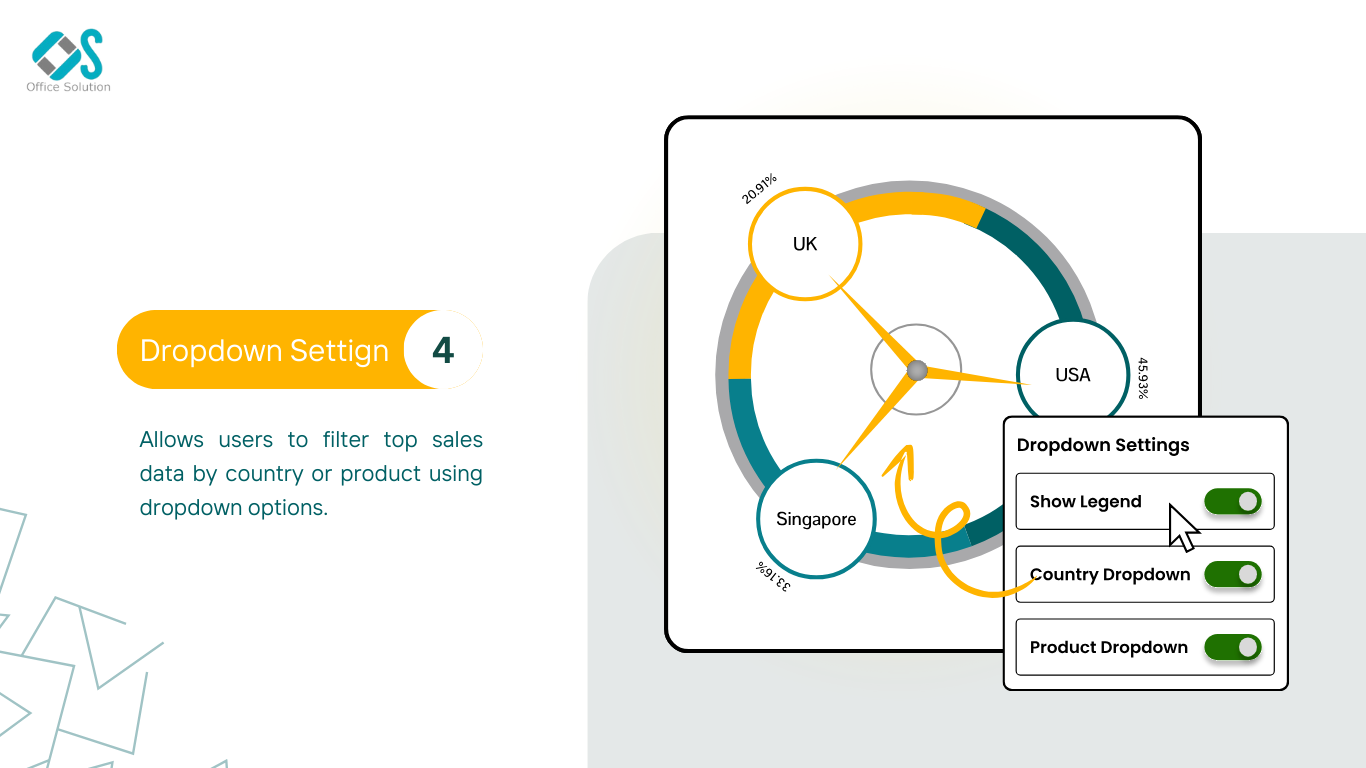
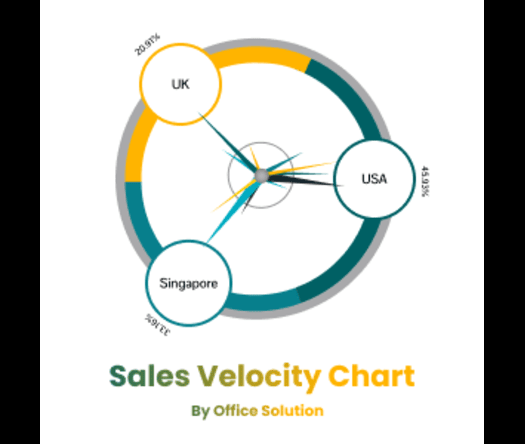
Sales Velocity Chart
Experience the versatility of Line and Scatter Plot Chart, where you c
Power BI Magic grid which allows Write back into the database, ML Capa
Empower your data analysis with our Bar Chart featuring export capabil
Cohort Chart