For more information visit our Microsoft app source link For more information visit our Microsoft app source link
Office Solution Capacity Monitoring tool enables organizations to track Centrally:-
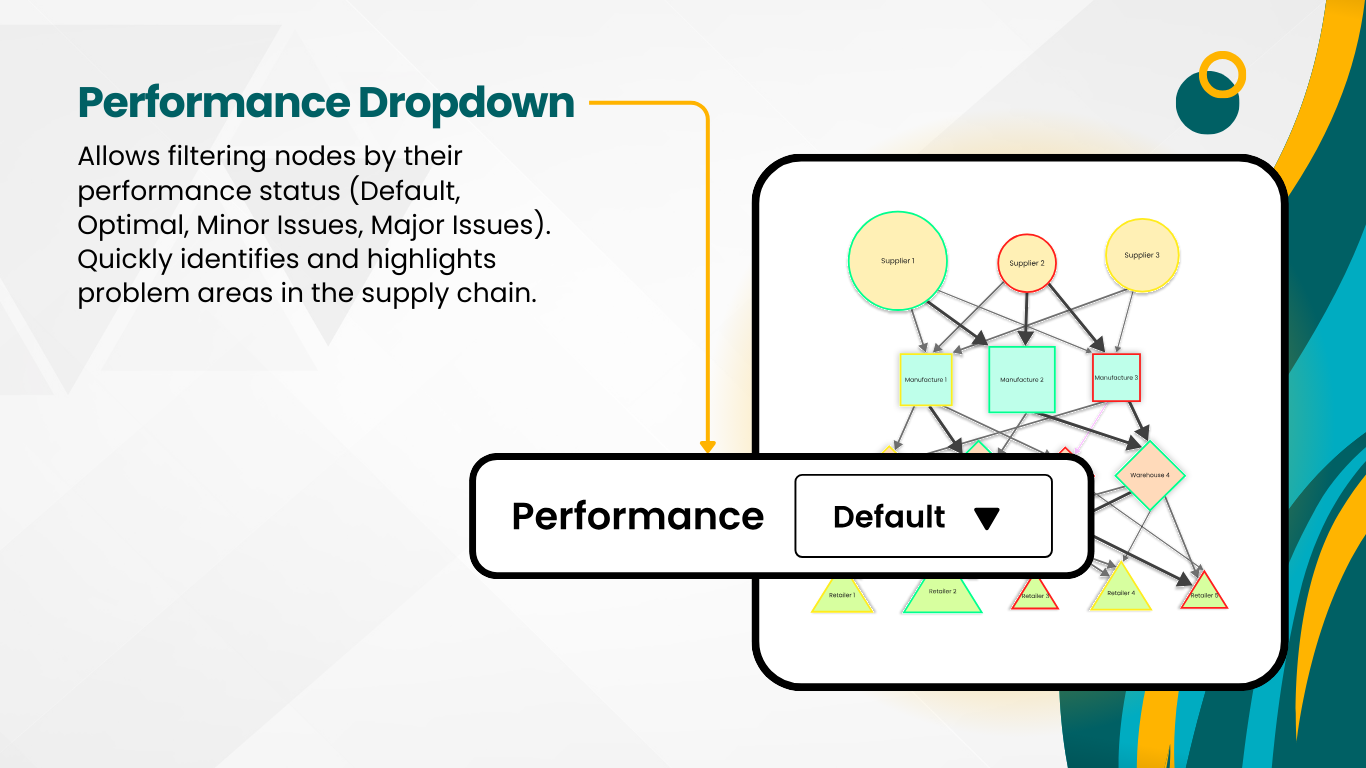
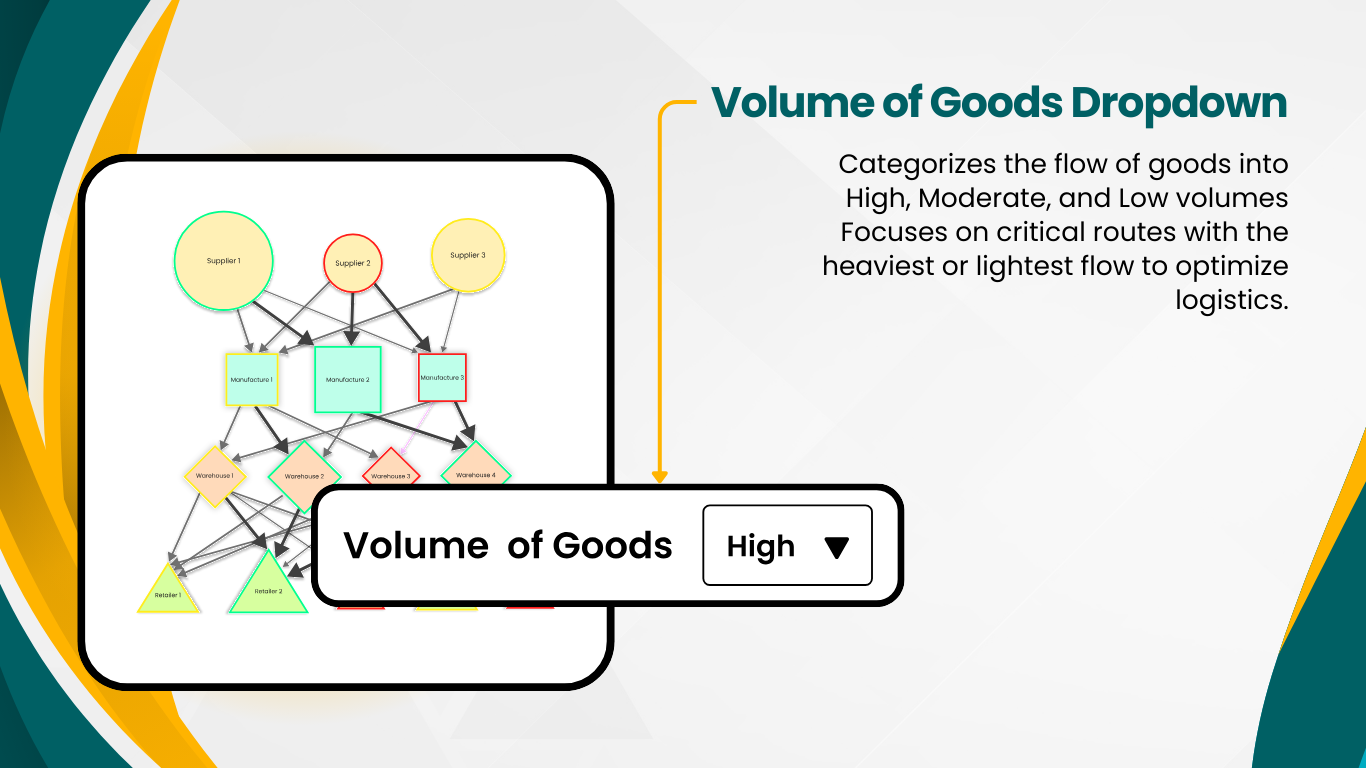
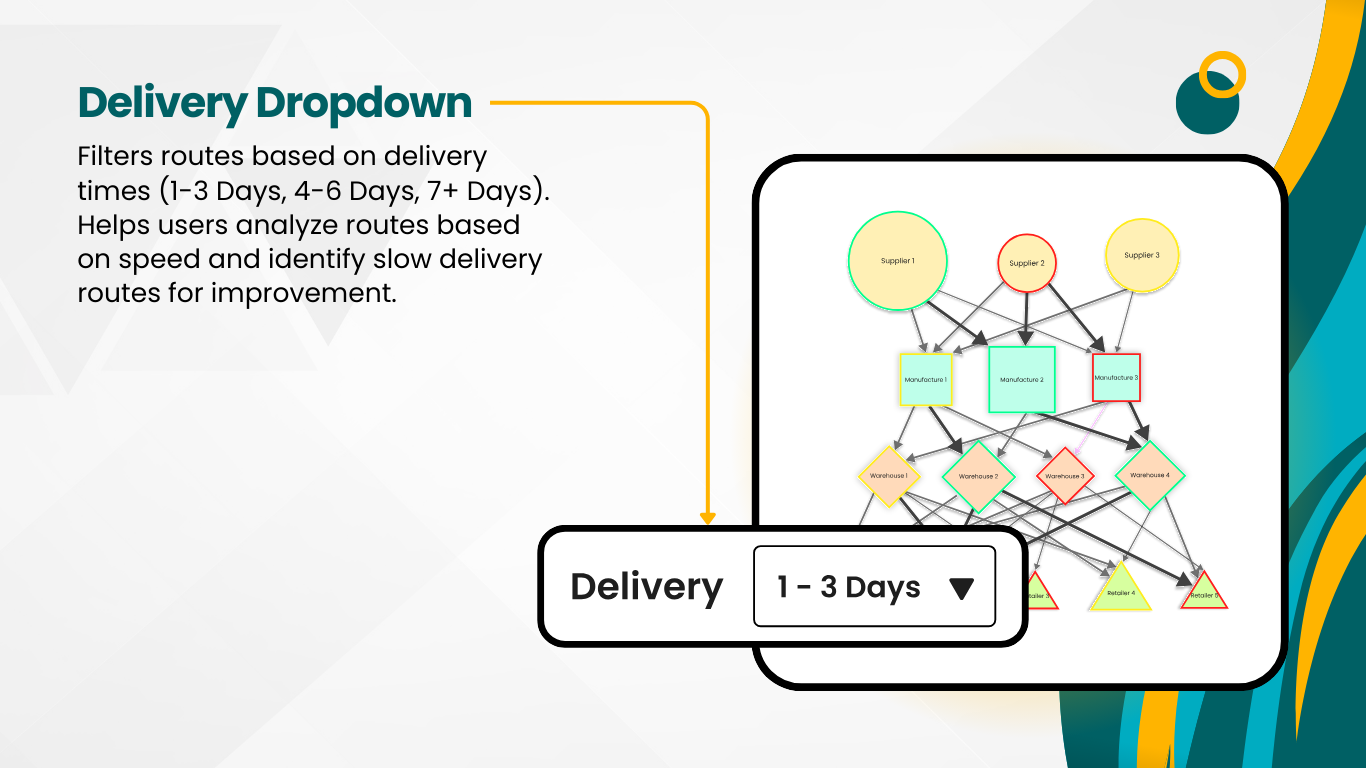
Supply Chain Network Flow Chart
Dynamic Price Elasticity Heat Map
Cohort Chart
Sales Velocity Chart
Lorenz Curve by Office Solution
T
Magic Grid Advanced Analytics ChatGPT Solution
The Spiral Plot by Office Solution offers a unique way to visualize da
Power BI Magic grid which allows Write back into the database, ML Capa