Product Detail

Trade Blotter Flow & Attribution River

Tool Is Certified by Microsoft:

Problem Statement

In modern institutional trading and trade operations, financial institutions process thousands of transactions daily across disparate systems. Trading desks and risk managers face severe obstacles in monitoring end-to-end execution journeys:

  1. Disconnected Lifecycle Views: Standard charts show orders, venue executions, allocations, and clearing settlements in isolated silos, obscuring where trade value and volume bottleneck or leak.

  2. Opaque P&L Attribution: Net profit and loss is rarely mapped directly onto physical trade flows, making it difficult to pinpoint whether gains and losses stem from venue selection, execution slippage, or desk routing.

  3. Performance Degradation with High-Volume Blotters: Typical visual components crash or freeze when fed institutional blotters containing tens of thousands of trade executions.

  4. Lack of Granular Deal Drill-Through: Executives see high-level totals but cannot quickly inspect individual trade tickets, counterparties, and settlement statuses without leaving the report.

The Trade Blotter Flow & Attribution River resolves these challenges by providing specialized capital markets capabilities:

  • High-Performance Aggregation Engine: Built to process over 100,000 transaction records in milliseconds with fluid 60 FPS responsiveness.
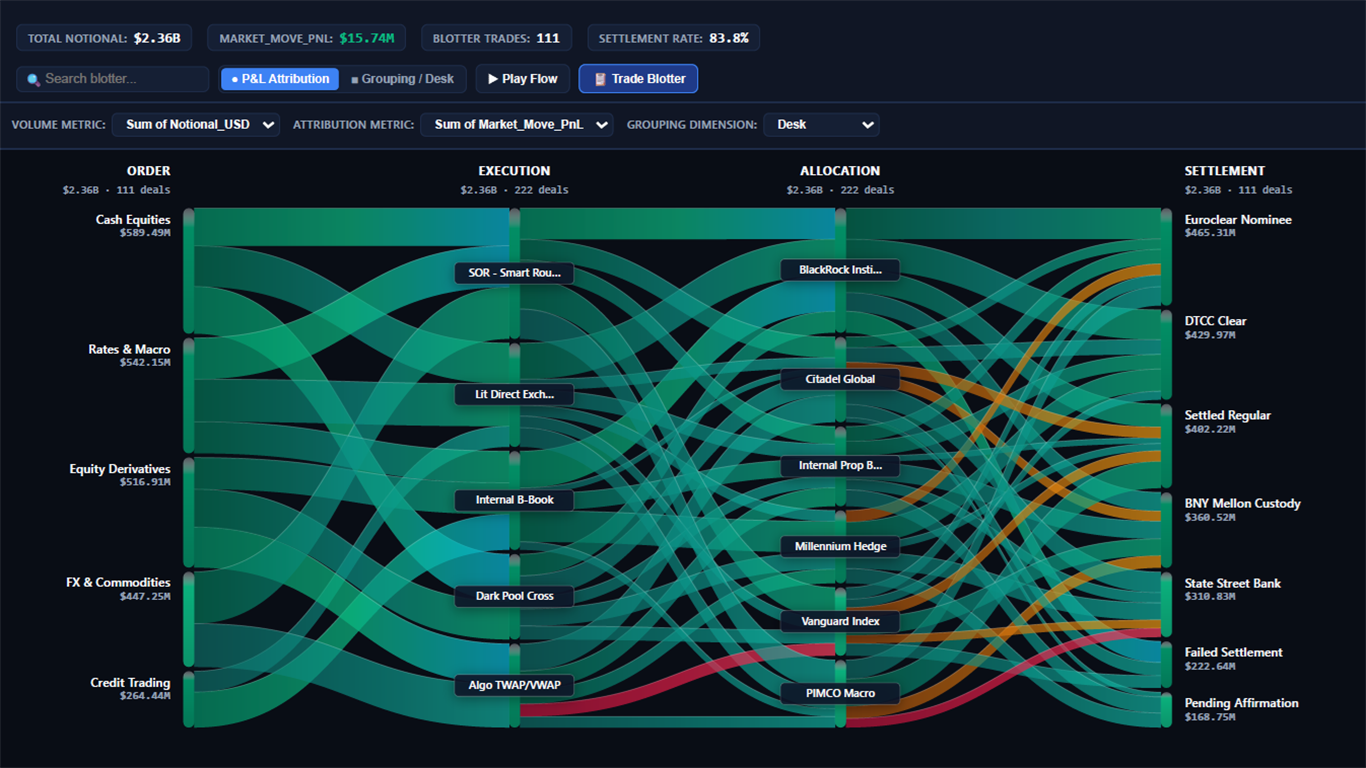
  • Dual-Mode P&L River Geometry: Fluid cubic bezier ribbons weighted by notional volume and shaded by dynamic multi-tone profit/loss attribution spectrums.
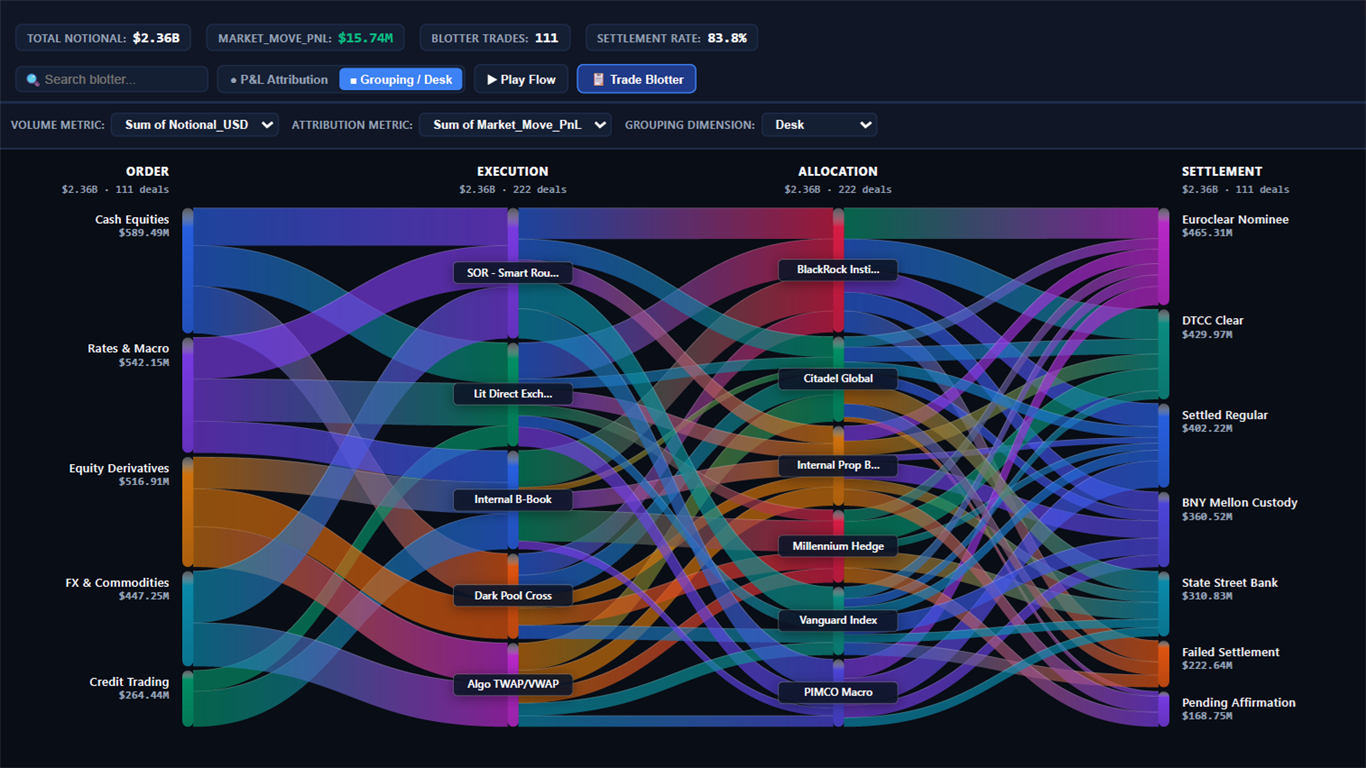
  • Dynamic Field Parameter Bar: Instant on-canvas switching of volume measures, P&L attribution fields, category dimensions, and stage models.
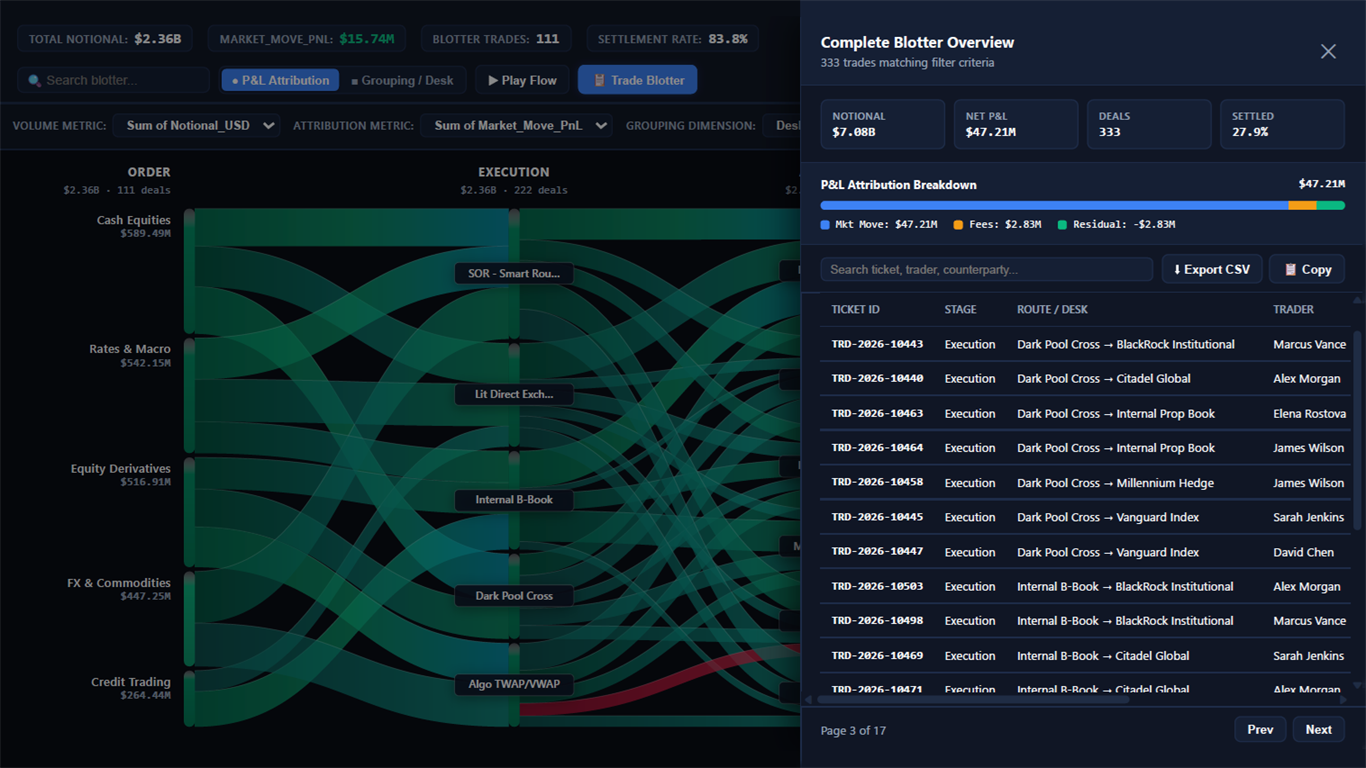
  • Contextual Blotter Drawer: Slide-out deal ledger with live searching, pagination, and direct CSV export for compliance and auditing.
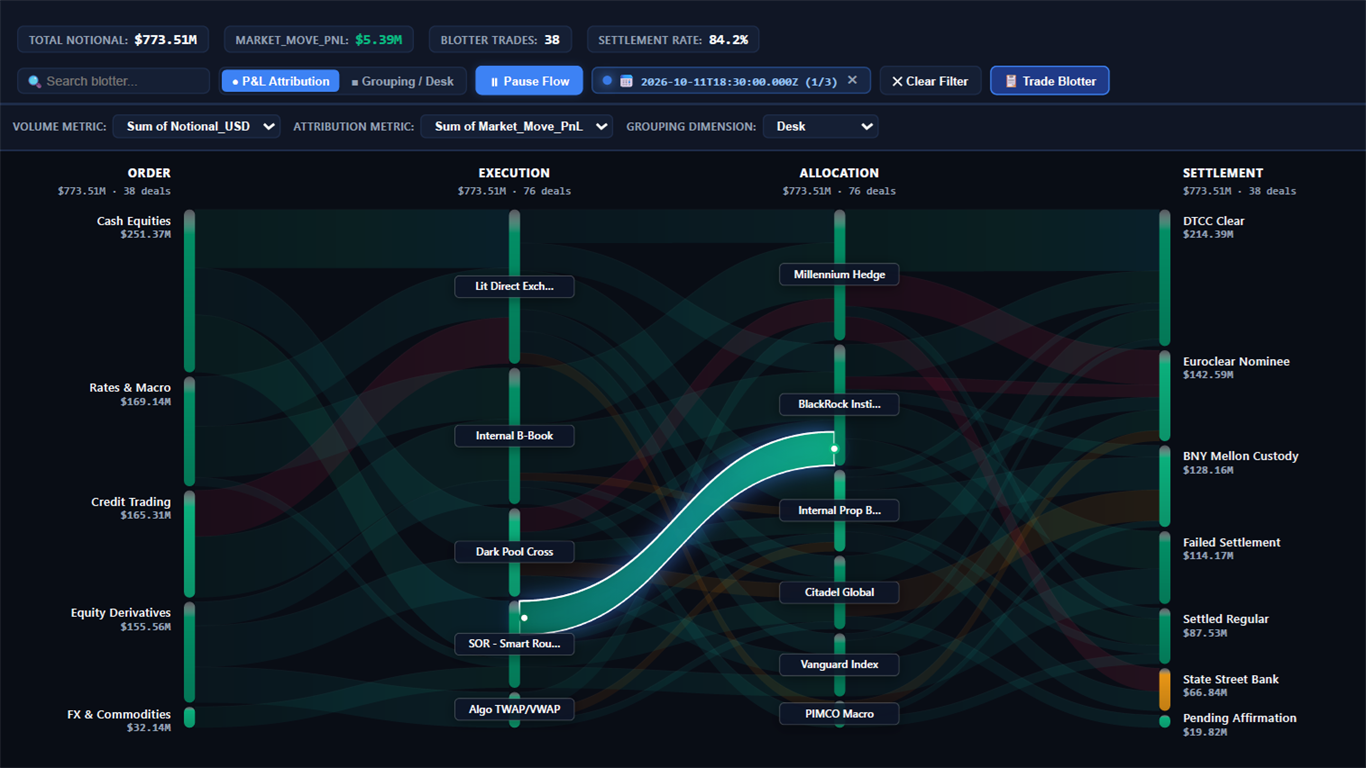
  • Timeline Playback Animation: Scrubber allowing users to step chronologically through trade dates and watch order flow shifts.

These features transform static blotter reporting into an interactive, real-time command center for trading desks and operations teams.

Conclusion

In conclusion, the Trade Blotter Flow & Attribution River delivers an indispensable solution for institutional trade monitoring and financial attribution in Microsoft Power BI. By uniting volume flow dynamics, multi-component P&L attribution, timeline playback, and deal-level blotter drill-through into a single responsive visual, it empowers traders, risk controllers, and operations executives to optimize routing efficiency, prevent settlement failures, and safeguard trading performance.

Key Features:

  1. End-to-End Lifecycle River Mapping:

    • Visualizes order initiation, execution routing, account allocation, and clearing settlement across sequential stages with smooth organic ribbons.
  2. Dynamic P&L Attribution Spectrum:

    • Visualizes profit and loss contribution across flows with dynamic multi-tone color scaling from deep emerald gains to rose-red losses.
  3. Executive KPI Summary Bar:

    • Real-time KPI metrics displaying Total Notional Volume, Net P&L, Total Blotter Deals, Settlement Rate, and Profitable Flow Percentage.
  4. Dynamic Field Parameter Bar:

    • Enables one-click toggling between alternative volume metrics, P&L measures, category dimensions, and stage definitions directly on canvas.
  5. Timeline Playback & Period Scrubber:

    • Step through dates or periods automatically to analyze shifting flow dynamics and execution velocity over time.
  6. Slide-Out Blotter Ledger Drawer:

    • Instant deal ticket inspection with live searching, sorting, pagination, and one-click regulatory CSV export.

Other products

Office Solution Capacity Monitoring tool enables organizations to track Centrally:-

Connected Scatter Plot chart

Connected Scatter Plot chart

Custom Slicer

The "Custom Slicer by Office Solution" is a certified Power

Circular Dendogram

The Circular Dendrogram Chart offers a unique and vis

MultiKPIGrid

A profit and loss statement summariz

Bar Chart With Export

Empower your data analysis with our Bar Chart featuring export capabil

Promo Projection

Multi-Book Risk Surface

Line And Scatter plot chart

Experience the versatility of Line and Scatter Plot Chart, where you c