Latest release

Financial Risk and Stock Risk Calculation

Popular visuals

Expand your reporting capabilities with our 37 certified Power BI custom visuals.

Magic Grid PBI Enterprise Solution

Bar Chart with Dynamic Range creation

Bar Chart Convertible with Scatter plot

Magic Grid PBI Report Burst Solution

Magic Grid Advanced Analytics ChatGPT Solution

POWER BI LOAD TESTING SOLUTION

Connected Scatter Plot chart

Dynamic Price Elasticity Heat Map

Supply Chain Network Flow Chart

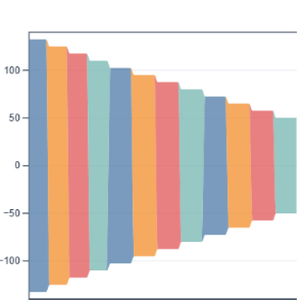
Hierarchical Decomposition Flow

Sentiment & Emotion Flow River

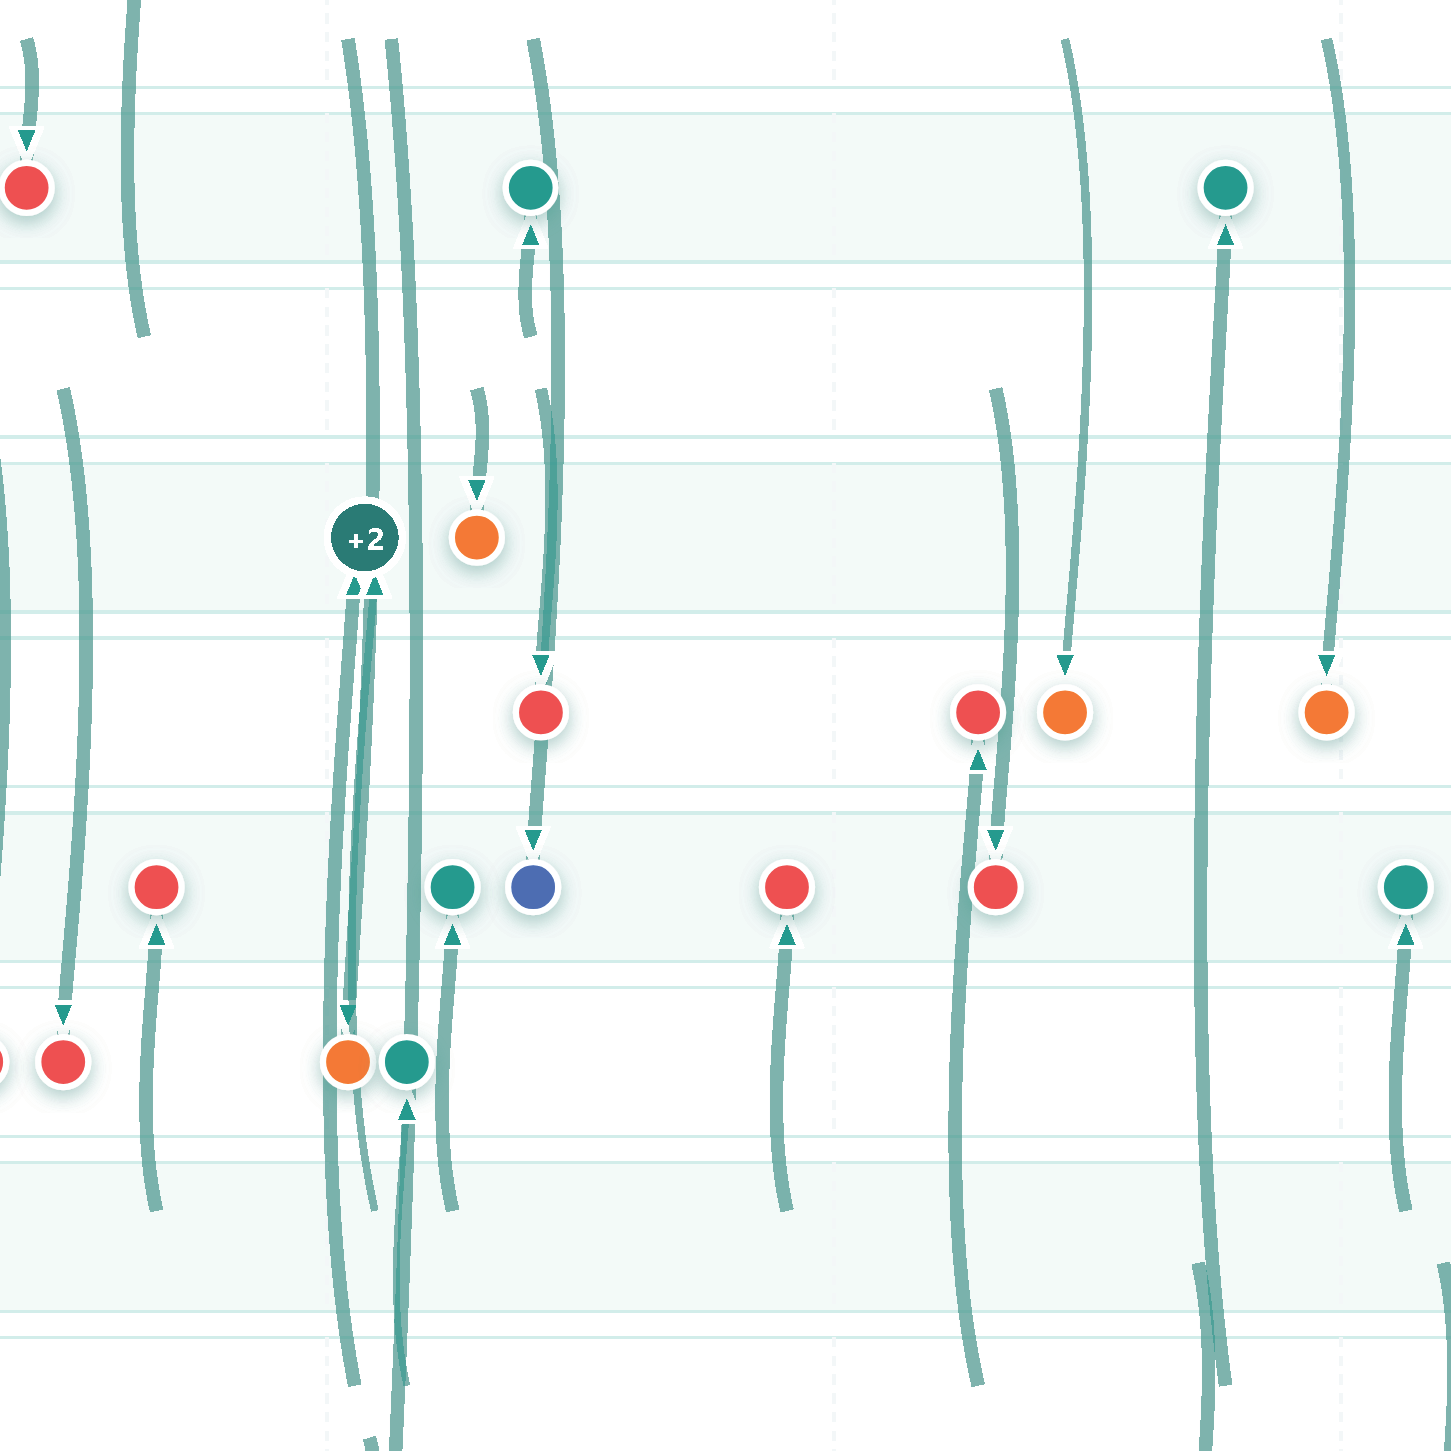
Multi-Entity Timeline Network

Adaptive Multi-KPI Radial Performance Matrix

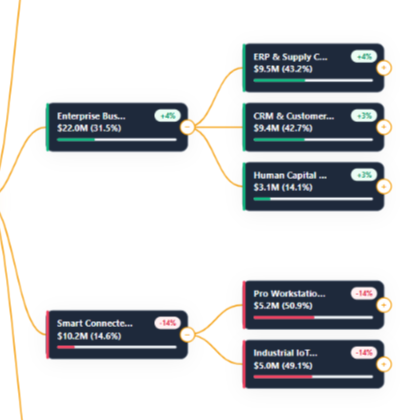
Deal Pipeline Contribution Tree

Relative Value & Spread Evolution Radar

Client Coverage Network Timeline

Trade Blotter Flow & Attribution River

Financial Risk and Stock Risk Calculation

Stacker Bar Chart With Top N

Line And Scatter plot chart

Magic Grid PBI Enterprise Solution

Bar Chart with Dynamic Range creation

Bar Chart Convertible with Scatter plot

Magic Grid PBI Report Burst Solution

Magic Grid Advanced Analytics ChatGPT Solution

POWER BI LOAD TESTING SOLUTION

Connected Scatter Plot chart

Dynamic Price Elasticity Heat Map

Adaptive Multi-KPI Radial Performance Matrix

Client Coverage Network Timeline

Financial Risk and Stock Risk Calculation

Stacker Bar Chart With Top N

Line And Scatter plot chart

Hierarchical Decomposition Flow

Sentiment & Emotion Flow River

Multi-Entity Timeline Network

Deal Pipeline Contribution Tree

Relative Value & Spread Evolution Radar

Trade Blotter Flow & Attribution River

If you have questions about our custom visuals, please visit our